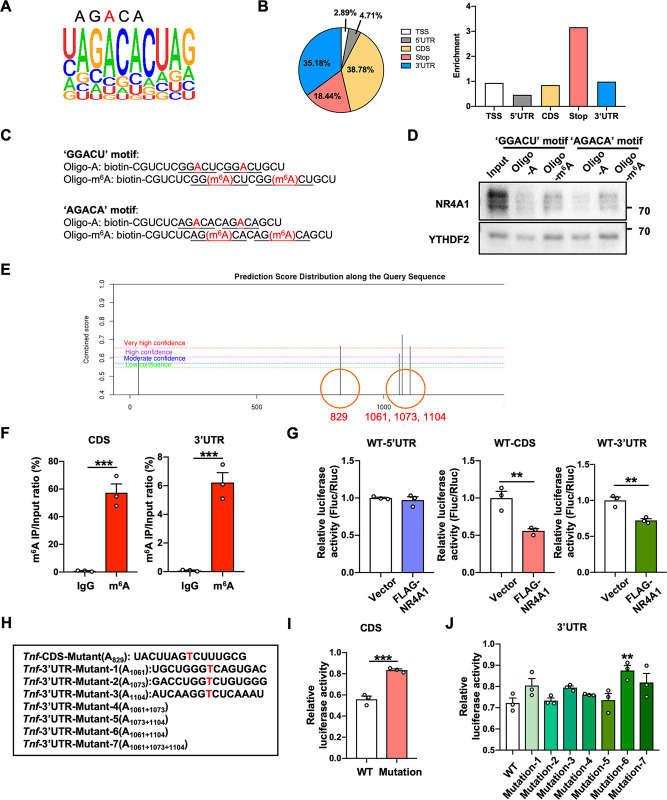
Fig 3. NR4A1 promotes Tnf mRNA degradation in an m6A-dependent manner.
(A) Binding motif identified by HOMER with NR4A1-binding peaks. (B) The distribution (left) and enrichment (right) of NR4A1-binding peaks identified by RIP-seq. (C, D) Immunoblot analysis of NR4A1 in the cytoplasmic fraction of ATP+LPS-treated primary microglia pulled down by m6A-containing or unmethylated oligonucleotides. (E) SRAMP software prediction of the m6A sites in Tnf mRNA. (F) m6A-RIP-qPCR analysis of m6A enrichment in the CDS and 3′ UTR of Tnf mRNA in BV2 cells (n = 3 biological repeats in each group). (G) Luciferase activities of the 5′ UTR, CDS, and 3′ UTR of Tnf in HEK293T cells overexpressing NR4A1 or empty vector (n = 3 biological repeats in each group). (H) m6A site mutations in the CDS and 3′ UTR of Tnf mRNA. (I, J) Relative luciferase activities of WT or mutant CDS of Tnf (I) and WT or mutant 3′ UTR of Tnf (J) in HEK293T cells overexpressing NR4A1 (normalized to Fluc/Rluc in HEK293T cells with empty vector) (n = 3 biological repeats in each group). Data are presented as mean ± SEM. In (F), (G), (I), two-tailed unpaired Student’s t test. In (J), one-way ANOVA with post hoc Dunnett’s test. *P < 0.05; **P < 0.01; ***P < 0.001. The underlying data for this figure can be found in S1 Data. The original blot for this figure can be found in S1 Raw Images. RIP-seq, RNA-binding protein immunoprecipitation sequencing; WT, wild-type.

