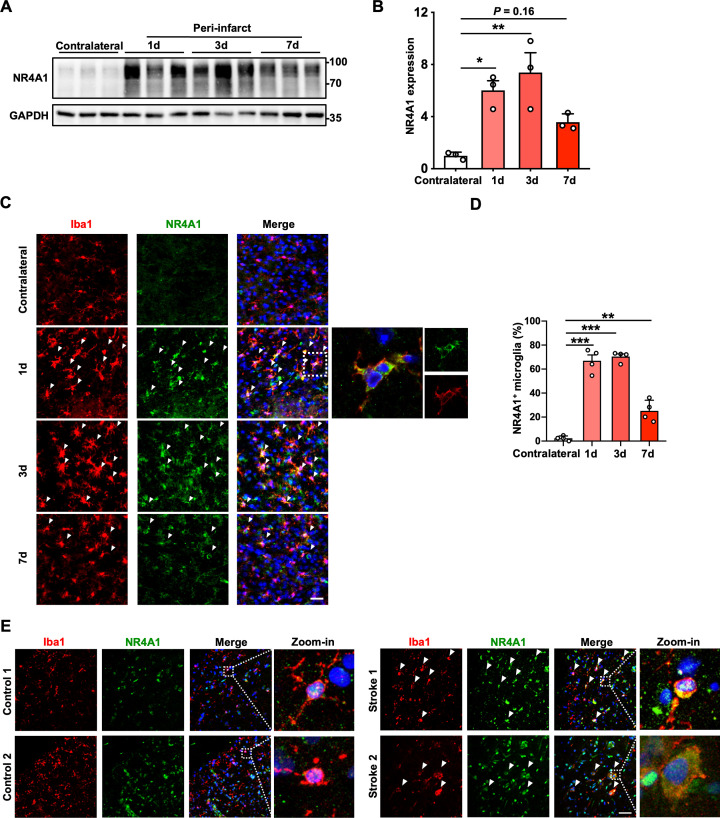
Fig 4. Microglial NR4A1 is up-regulated in both mice and patients with ischemic stroke.
(A) Immunoblot analysis of NR4A1 in contralateral and peri-infarct tissue 1 day, 3 days, and 7 days after MCAO. (B) Quantification of immunoblot analysis of NR4A1 expression in contralateral and peri-infarct tissue 1 day, 3 days, and 7 days after MCAO showing that brain ischemia induced NR4A1 expression in peri-infarct tissue (n = 3 mice in each group). (C) Representative images of the contralateral and peri-infarct cortices of mice 1 day, 3 days, and 7 days after MCAO showing localization of NR4A1 (green) in Iba1+ (red) microglia. The inset shows a digitally magnified field of a single cell from the image. Scale bar, 30 μm. (D) Quantification of the percentage of NR4A1+ microglia showing that MCAO-induced NR4A1 expression in microglia in the peri-infarct cortex (n = 4 mice in each group). (E) Images of human brain samples from 2 non-stroke patients and 2 stroke patients. The inset shows a digitally magnified field of a single cell from the image. Stroke-induced NR4A1 expression in human microglia. Scale bar, 50 μm. Data are presented as mean ± SEM. In (B) and (D), one-way ANOVA with post hoc Dunnett’s test. *P < 0.05; **P < 0.01; ***P < 0.001. The underlying data for this figure can be found in S1 Data. The original blot for this figure can be found in S1 Raw Images. MCAO, middle cerebral artery occlusion.

