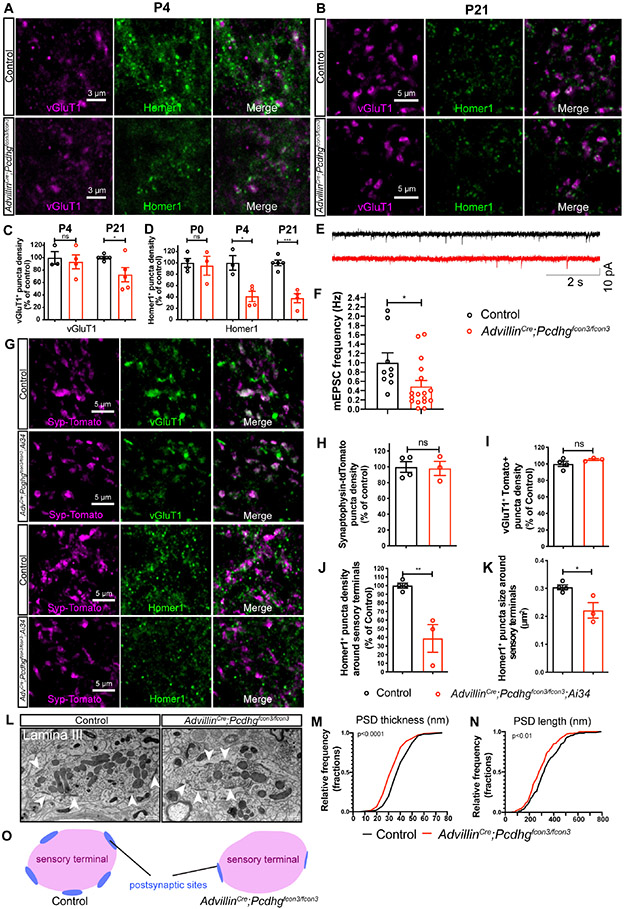
Figure 3. Pcdhgs function in primary sensory neurons for postsynaptic specialization of synapses between sensory axon terminals and spinal cord neurons.
(A and B) IHC images of spinal cord dorsal horn lamina III from P4 (A) and P21 (B) littermate control and AdvillinCre;Pcdhgfcon3/fcon3 mice.
(C and D) Normalized densities of vGluT1+ (C) and Homer1+ (D) puncta from littermate control and AdvillinCre;Pcdhgfcon3/fcon3 mice. Student’s unpaired t test.
(E) Representative spontaneous mEPSC traces recorded in random spinal cord neurons in lamina III from P13-P16 littermate control (n = 3 animals) and AdvillinCre;Pcdhgfcon3/fcon3 mice (n = 4 animals).
(F) Presynaptic Pcdhg deletion decreases the frequency of spontaneous mEPSCs in the spinal cord neurons. Each dot is the mEPSC frequency of a spinal cord neuron. Mann-Whitney test.
(G) IHC images of spinal cord lamina III from P21 littermate control and AdvillinCre;Pcdhgfcon3/fcon3;Ai34 mice.
(H-K) Normalized densities of synaptophysin-tdTomato (Ai34) puncta density (H) and vGluT1+ Tomato+ double positive puncta (I). The size and normalized density of Homer1+ puncta around Tomato+ sensory terminals is quantified in (K) and (J), respectively. Each dot represents one animal. Student’s unpaired t test.
(L) EM images of synaptic glomeruli from lamina III in spinal cord dorsal horn from a control animal and a AdvillinCre;Pcdhgfcon3/fcon3 animal. Arrowheads point to the postsynaptic sites formed within the glomeruli. Scale bars represent 500 nm.
(M and N) Quantifications of PSD thickness (M, control 42.1 ± 0.6 nm, 304 synapses from 3 animals; AdvillinCre;Pcdhgfcon3/fcon3: 32.4 ± 0.6 nm, 286 synapses from 3 animals). Quantifications of PSD length (N, control 340.0 ± 7.1 nm; AdvillinCre;Pcdhgfcon3/fcon3: 299.3 ± 6.2 nm). Kolmogorov-Smirnov test.
(O) Summary of the synaptic formation phenotype in the AdvillinCre;Pcdhgfcon3/fcon3 mutants.
ns, not significant; *p < 0.05; **p < 0.01; ***p < 0.001.

