
Figure C1.
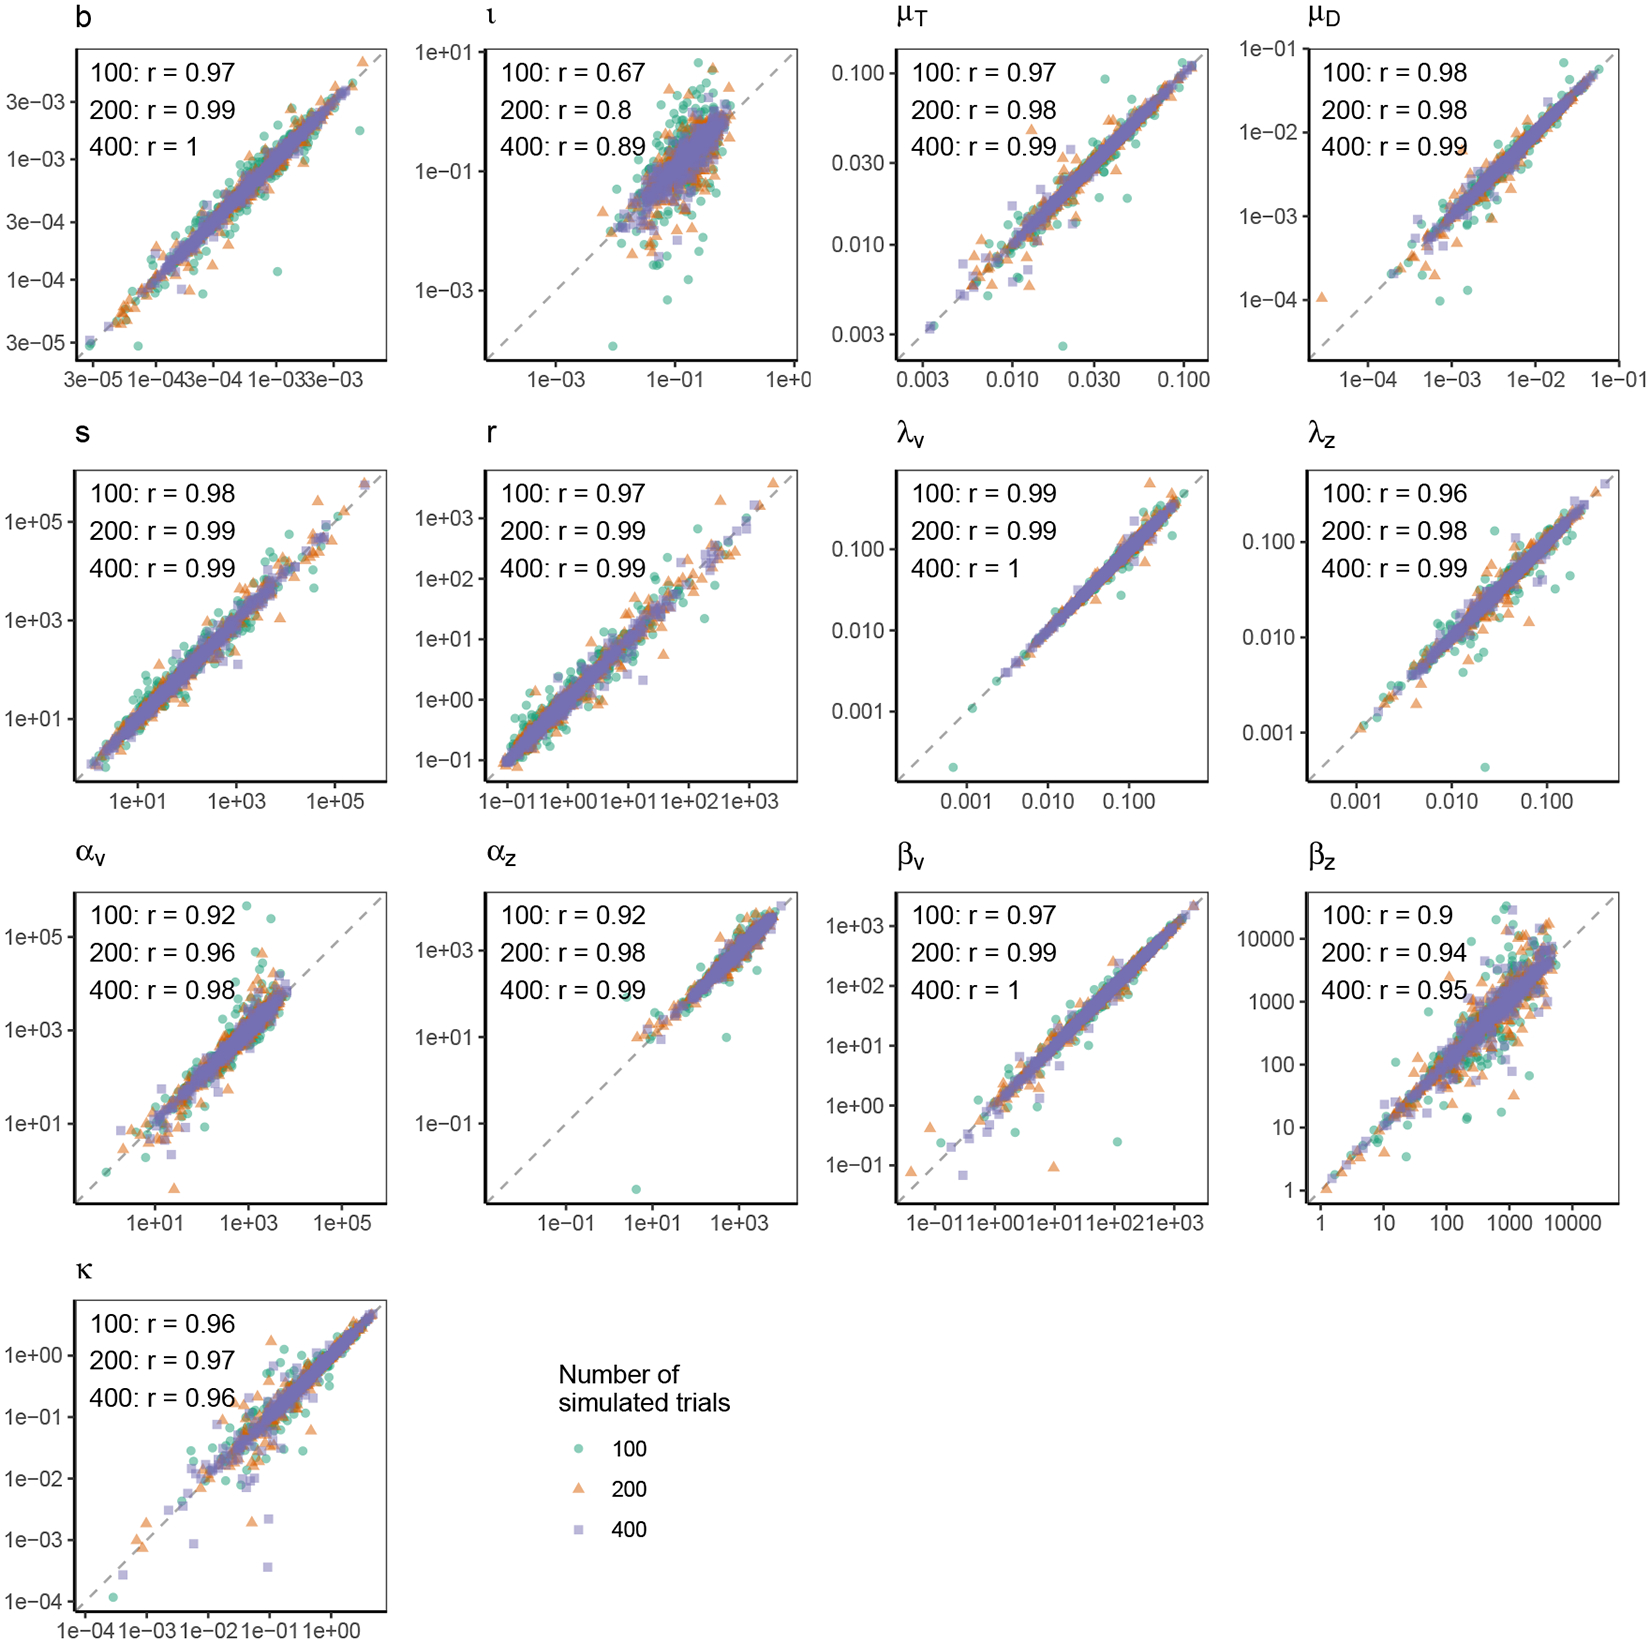
Results from parameter recovery simulations for different SCRI parameters. Parameter values used to generate simulated data are on the horizontal axis while fitted parameter values (to the simulated data) are on the vertical axis. Text in each panel provides the Pearson correlation between generating and fitted parameter values in each panel for each value of the number of simulated trials. Axes are on logarithmic scales. Dashed lines show the line of equality.