
Figure G1.
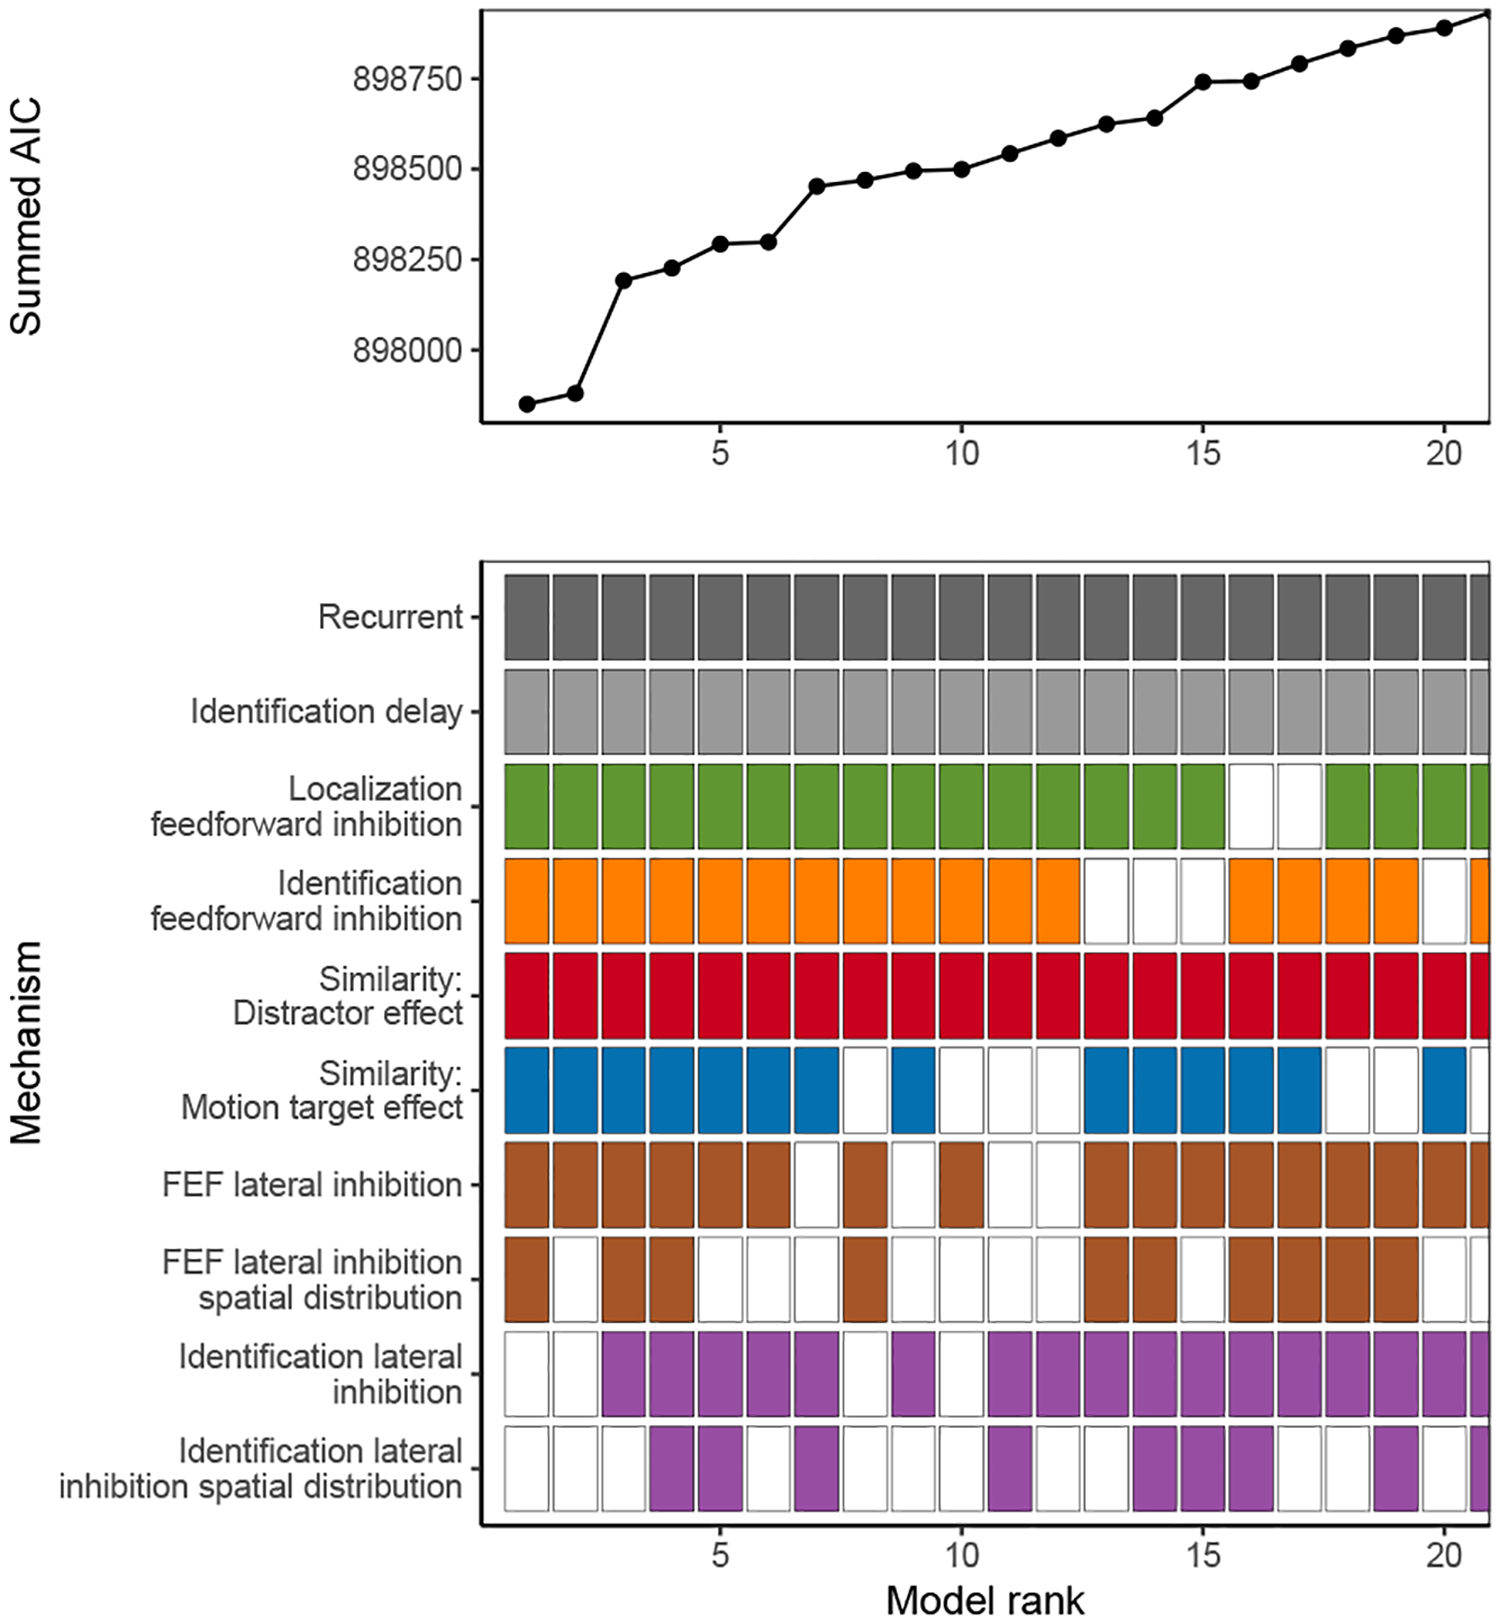
Summed AIC across all neurons in the dataset for each combination of SCRI mechanisms. Filled boxes in the bottom panel indicate the mechanism is included, empty boxes that it is not. Colors for each box correspond to the colors used to illustrate the corresponding mechanism in Figure 3. Combinations are ordered by their summed AIC across neurons. There are a total of 576 possible combinations, but the plot is restricted to those with the 20 lowest summed AIC.