
Figure 8.
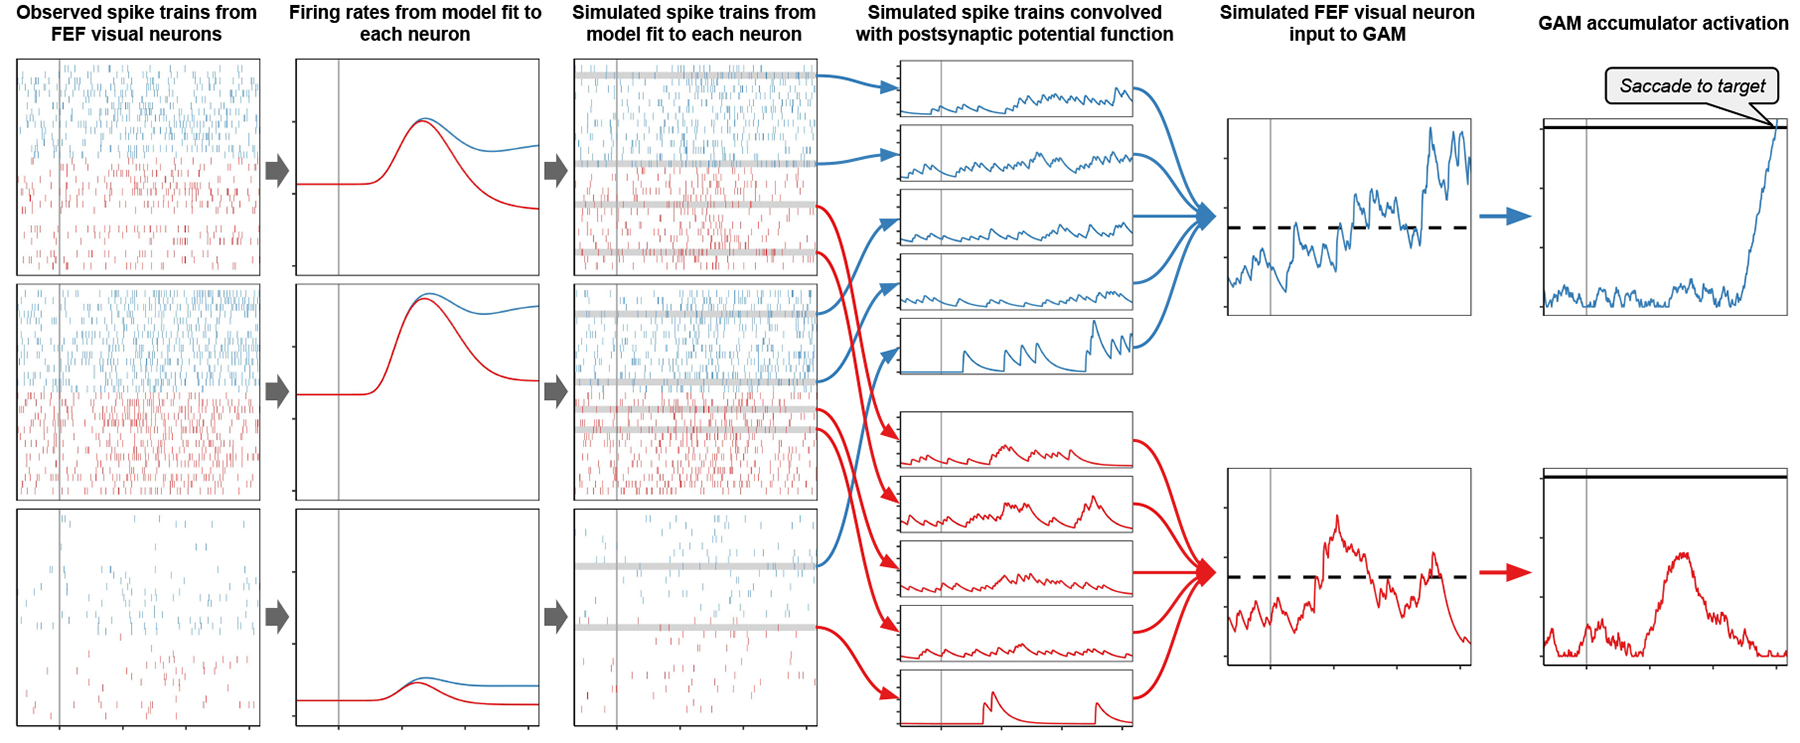
Pipeline from observed spiking activity through SCRI and GAM to predicted saccade behavior. The first column shows spikes observed from three FEF visual neurons when the target (blue) or distractor (red) appeared in the RF. Observed spiking activity is used to fit parameters of SCRI which describes the latent spike rates of each neuron (second column). The SCRI spike rates are used to simulate Poisson spike trains for each neuron with each RF for each condition (third column). To simulate the visual evidence available for accumulation by a particular monkey in a particular visual search trial, we sampled multiple simulated spike trains from the SCRI fits to neurons from that monkey corresponding to the RF’s and condition on that trial. Each simulated spike train was convolved with the postsynaptic response filter used in the original descriptions of these neurons (fourth column). The input to each GAM accumulator was the average of the convolved spike trains from neurons with RF’s corresponding to the accumulator’s movement field, weighted by the inverse of the expected maximum spike rate for the neuron that generated the spike train (fifth column). Response choice and time were determined when one of the GAM accumulators reached a threshold level of activity (sixth column).