
Figure 9.
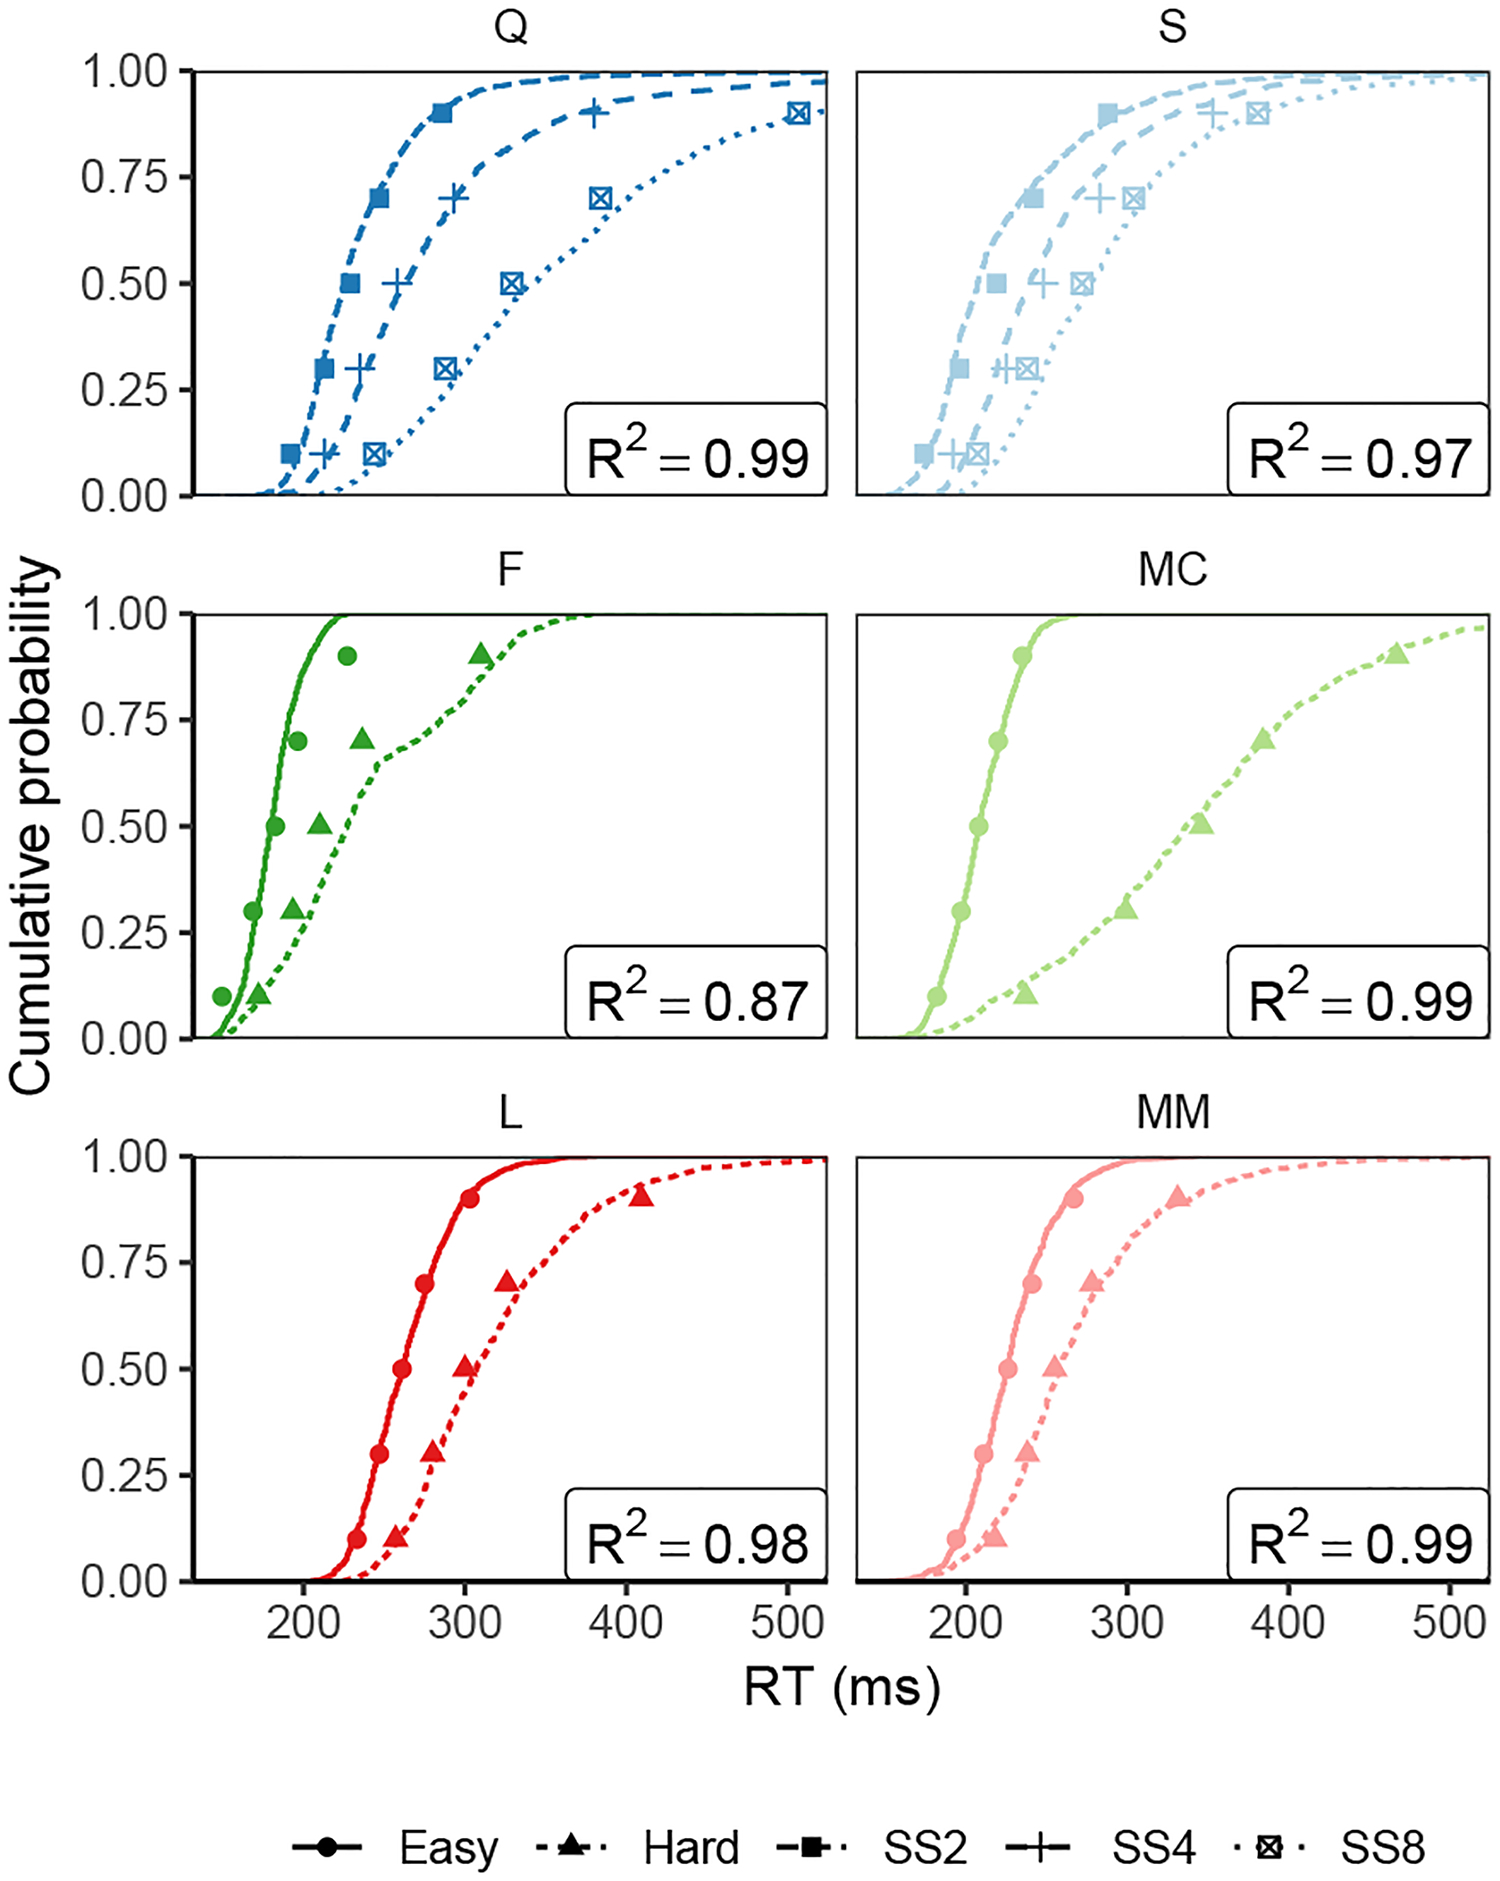
Observed (points) and predicted (lines) cumulative distribution functions for correct saccade response times (RT). Points depict the 10%, 30%, 50%, 70% and 90% quantiles of the observed correct RT distributions for each monkey in each condition (“SS” = “Set size”). Lines represent the cumulative distribution of correct RT’s simulated by GAM using simulated FEF visual neuron activity from our model as evidence. GAM parameter settings given in Table H1.