
Figure 8.
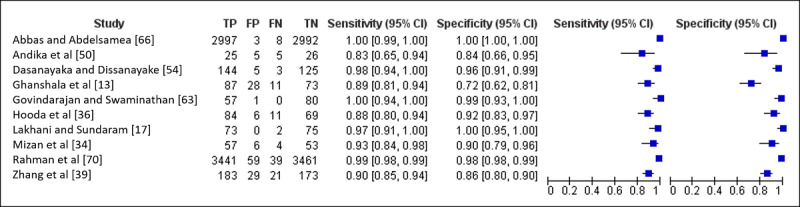
Forest plot of pooled sensitivity and specificity of the 10 included studies. FN: false negative; FP: false positive; TN: true negative; TP: true positive.
Official websites use .gov
A
.gov website belongs to an official
government organization in the United States.
Secure .gov websites use HTTPS
A lock (
) or https:// means you've safely
connected to the .gov website. Share sensitive
information only on official, secure websites.
Forest plot of pooled sensitivity and specificity of the 10 included studies. FN: false negative; FP: false positive; TN: true negative; TP: true positive.