
Figure 2.
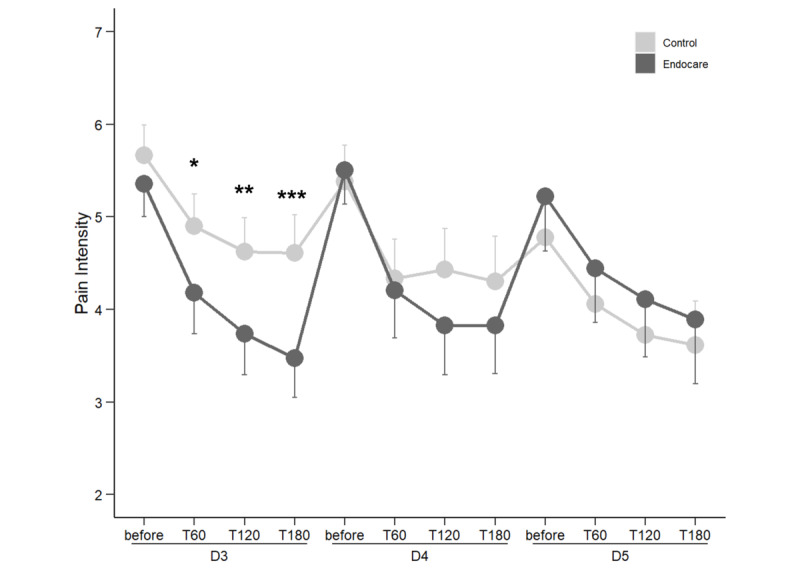
Comparison of pain intensity between treatment arms on days 3 to 5 of participation. D: day; T: time (minutes). ***P<.001, **P<.01, *P<.05.
Official websites use .gov
A
.gov website belongs to an official
government organization in the United States.
Secure .gov websites use HTTPS
A lock (
) or https:// means you've safely
connected to the .gov website. Share sensitive
information only on official, secure websites.
Comparison of pain intensity between treatment arms on days 3 to 5 of participation. D: day; T: time (minutes). ***P<.001, **P<.01, *P<.05.