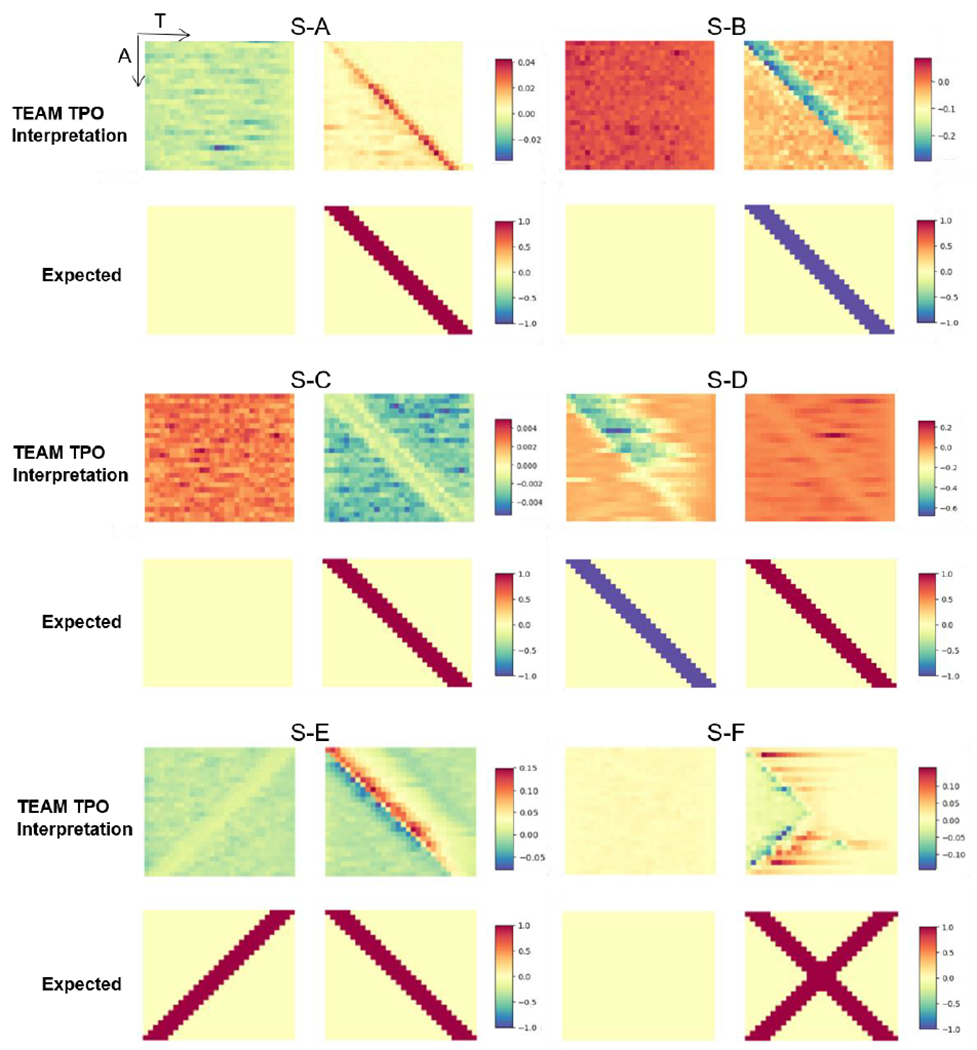
Fig. 6.

The figure shows the results of TEAM interpreting the temporal pattern occurrence (TPO) and their corresponding expected (ground truth) for simulation S-A through S-F. The left and right plots represent the negative and positive classes, respectively, for each representation. The upper plots show the heatmap are the mean gradient of the saliency map representing the interpreted TPO. The x-axis represents time, and the y-axis corresponds to each sample. The lower plots display the expected TPO, where each highlighted row in the y-axis represents five consecutive time points. For the null class, the expected TPO is null. It should be noted that the subject display sequence in y-axis is the sequence utilized for initializing simulation, and used for better visualization, the shuffled dataset is used for training, evaluation, and interpretation.
