
Fig. 7.
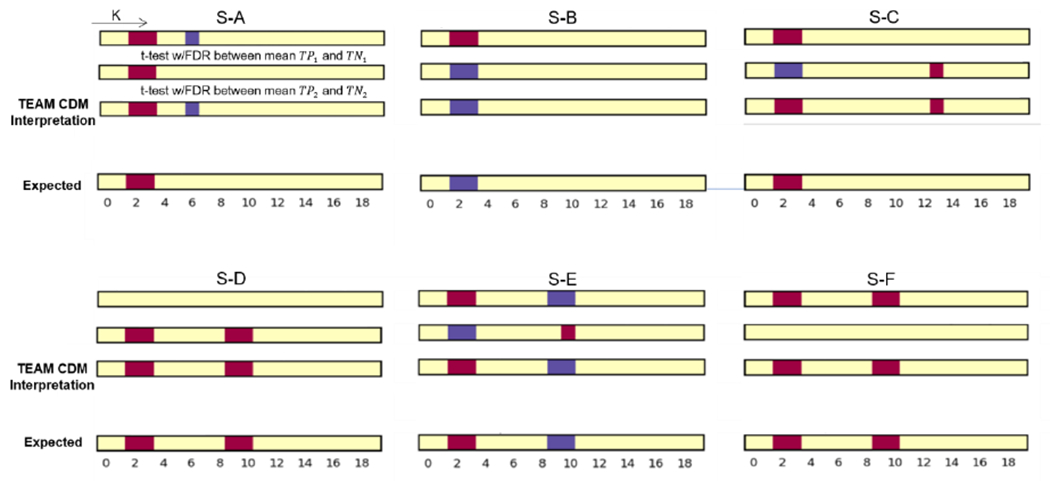
The figure shows the results of TEAM interpreting the class difference map (CDM) and their corresponding expected (ground truth) for simulation S-A through S-F. The top two plots are the statistical test result with FDR correction (p=0.05, and q=0.05) for - and - corresponded input, respectively. The sign of the maximum class difference was retained in the final CDM result. The bottom is the ground-truth feature difference plot. The red cell in feature k represent the average of positive class for k-th feature is significantly greater than negative class, blue cell represents the negative class is significantly greater than the positive class.