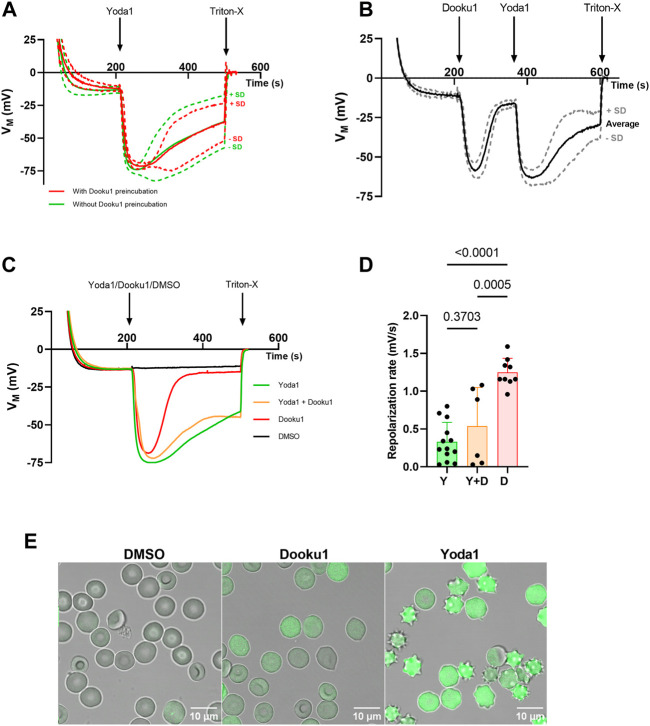
FIGURE 1.
Dooku1 alone can trigger a Gárdos effect. (A) Evolution of RBC membrane potential after injection of Yoda1 (625 nM, green, n = 13) without any pre-incubation, and Yoda1 (625 nM, red, n = 5) after a pre-incubation for 15 min at 37°C with Dooku1 (10 µM). Mean traces are plotted with their SD envelopes (B) Evolution of membrane potential after challenging the cells successively with Dooku1 (10 µM) and then with Yoda1 (625 nM). Traces represent average ± SD, n = 6. The mean trace was plot with its SD envelope (C) Changes in RBC membrane potential after injection of Yoda1 (625 nM, green, n = 13), Dooku1 (10 μM, red, n = 9), and simultaneously Yoda1 (625 nM) and Dooku1(10 μM, orange, n = 6). The black line represents control done with vehicle alone (DMSO, n = 4). Traces represent average (SD envelope is not drawn for sake of clarity). (D) Repolarization rate in different conditions measured right after maximum hyperpolarization. The repolarization values were obtained by calculating the derivative values between two-time points during which the repolarization takes place. Histograms represent means ± SD for each condition. (E) Confocal microscopy images of Fluo-4-loaded RBC 1 min after perfusion of DMSO 0.1% (left), Dooku1 (10 μM; middle) or Yoda1 (625 nM; right).

