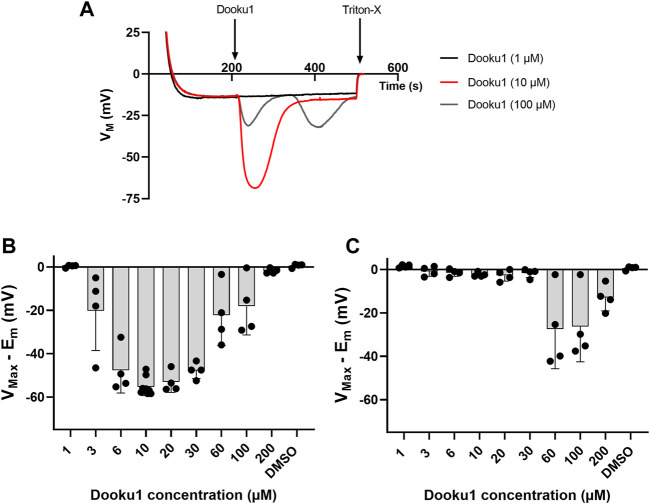
FIGURE 2.
Dooku1 dose-response curve. (A) Variations in membrane potential after addition of Dooku1 at different concentrations: 1 µM (black trace), 10 µM (red trace), and 100 µM (grey trace). Traces represent means of n = 4 independent replicates for each condition. SD envelopes were not added for clarity reasons (B,C) Maximal hyperpolarizations induced by increasing concentrations of Dooku1. Histograms represent the maximal hyperpolarizations (VMax) that were reached, from which were deduced the nominal resting membrane potential (Em). In (B) values of the first hyperpolarization occurring immediately after Dooku1 injection; and in (C) values of the second hyperpolarization, when occurred, which was delayed in time. Histograms represent means ± SD of n = 4 experiments.

