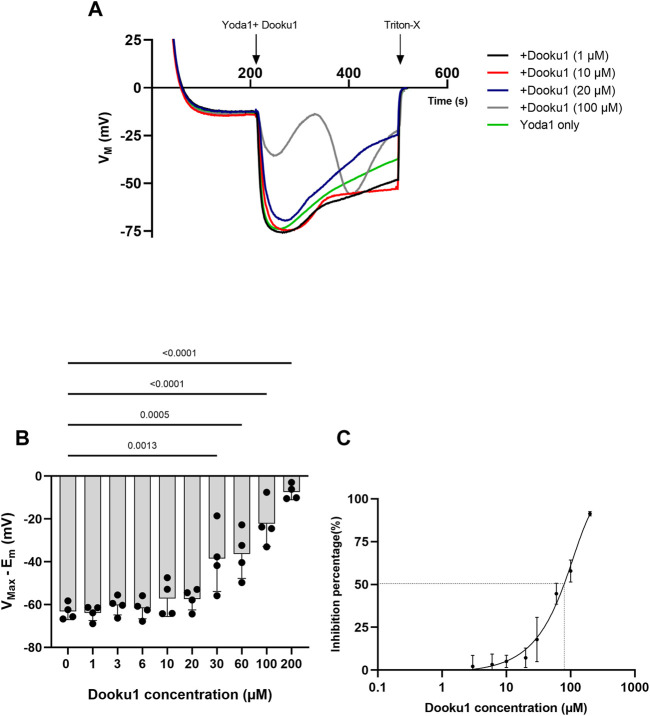
FIGURE 3.
Dooku1 inhibitory effects on Yoda1-induced hyperpolarizations (A)Variations in membrane potentials in response to Dooku1 at different concentrations 1 µM (black trace), 10 µM (red trace), 20 µM (blue trace), and 100 µM (grey trace), added simultaneously with Yoda1 (625 nM). Yoda1 alone (green trace). Traces represent means of 4 independent experiments for each condition. SD envelopes were not added for clarity reasons (B) First maximal hyperpolarization observed with increasing Dooku1 concentrations, added simultaneously with Yoda1 (625 nM). Histograms represent means ± SD (n = 4), (C) Dose-response curve of Yoda1-induced hyperpolarizations inhibition by Dooku1 (n = 3) according to the first hyperpolarization only.

