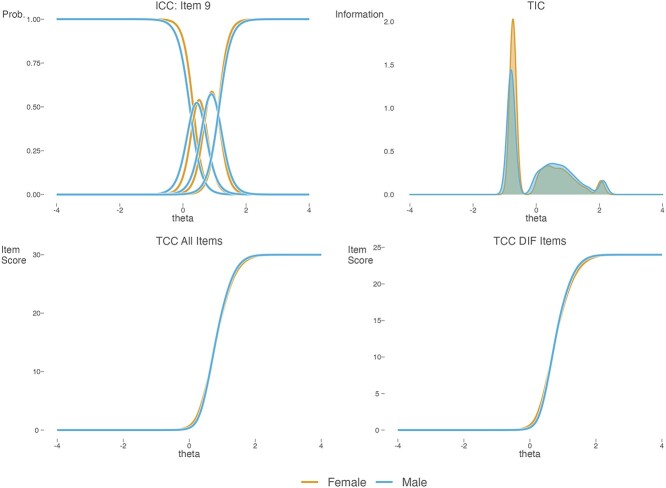
Fig. 2.
Item and test characteristic curves for Item 9 (remembering dates) separated by sex. Top left: Overlapping item characteristic curves (ICCs) for men and women. Top right: Overlapping test information curves (TIC) for men and women. Bottom left: Test characteristic curves for men and women, considering all Functional Activities Questionnaire items. Bottom right: Test characteristic curves for men and women, considering only items flagged as DIF (Items 1–4; 7–10). Note: Despite slight differences in difficulty for the lowest response (leftmost ICC, and leftmost TIC distribution), the predominant trend is of overlap in item-test characteristics across the two groups even when only considering the items flagged as DIF (bottom right figure).

