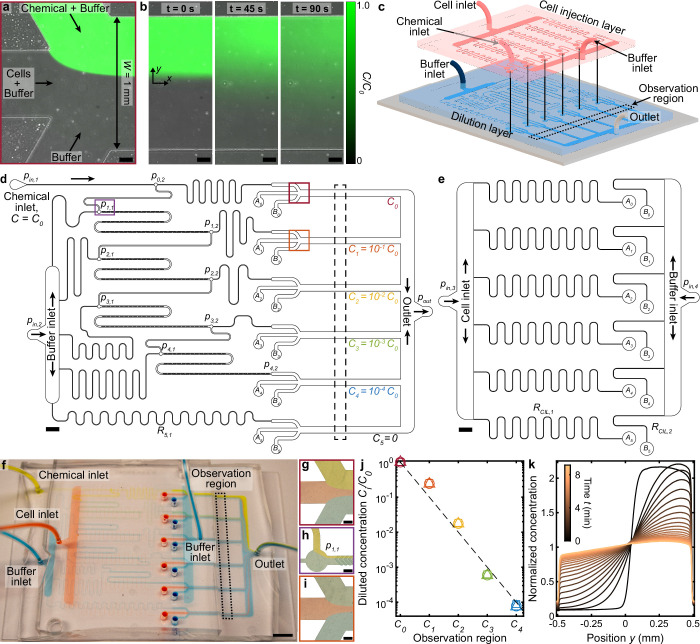
Figure 1. Multiplexed microfluidic device for simultaneous chemotaxis assays.
(a,b) Continuous flow through a microfluidic junction (a) stratifies chemostimulus, cell, and buffer solutions, demonstrated here with fluorescein, DI water, and DI water, respectively. Upon halting the flow (b) diffusion establishes a chemical gradient across the channel, which is repeated at each observation channel in the MCD (d, red and orange boxes). Scale bars, 0.1 mm. (c) Assembly of the MCD showing the PDMS dilution layer (blue) and cell injection layer (red) microchannels mounted on a glass slide (grey; Materials and methods). (d) Scaled drawing of the dilution layer, which receives chemical (pressure, ) and buffer () solutions. Initial chemical concentration (C0) is sequentially diluted 10-fold to each of four additional concentrations (), plus a control solution (). These six chemostimulus solutions are merged separately with additional cell () and buffer () solutions from the cell injection layer (e) for chemotaxis assays in respective observation channels (dashed black box, corresponding to c and f). (e) Scaled drawing of the cell injection layer which injects a cell suspension () and buffer solution () into the dilution layer (; Materials and methods). Scale bars d,e, 2 mm. (f) Photograph of the completed MCD with dyed water to visualize the chemical (yellow), cell (red), and buffer (blue) fluid streams in the channel network. Scale bar, 5 mm. (g) Stratified chemical (C0), cell, and buffer solutions in the first observation region (d, red box). (h) Dilution of the chemical (C0) by the buffer prior to mixing in the first micromixer (Stroock et al., 2002) to produce concentration C1 (d, purple box). (i), Stratified chemical solution after initial dilution (C1, green) in the second observation region (d, orange box). Scale bars g-i, 0.2 mm. (j) Measured chemical concentrations (see Materials and methods) generated from the dilution microchannels (d) for various driving pressures (square, circle, and triangle, respectively). (k) Measured evolution of the chemical gradient (b) produced in the C0 observation region (Figure 1—figure supplement 3; Materials and methods) by the MCD shows the chemical diffusion across the channel with increasing time t.

