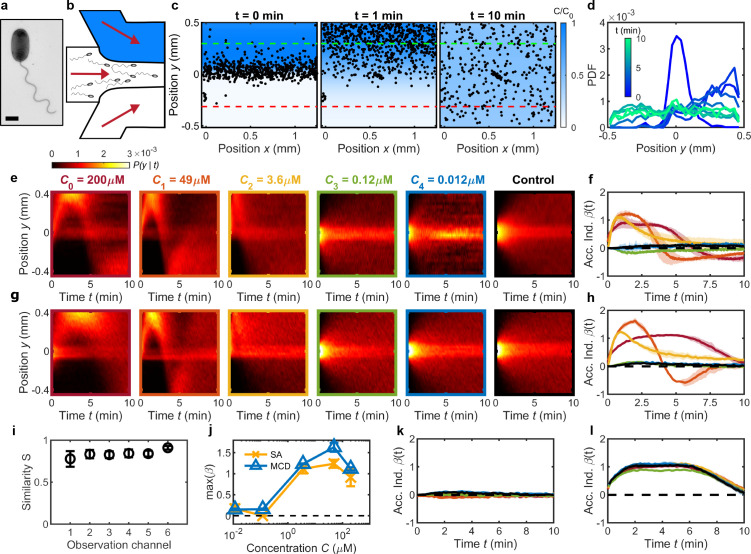
Figure 2. Validation of MCD and measurement of V. alginolyticus chemotactic performance toward serine.
(a) TEM image of V. alginolyticus (Materials and methods). Scale bar, 1 μm. (b) A single chemotaxis assay (SA) with a single conventional microfluidic device flows chemostimulus (top, blue), cell suspension (middle), and buffer (bottom) streams into the observation region (Materials and methods). (c) SA with chemostimulus (serine, ) showing measured cell positions (V. alginolyticus, black dots) at various times after initial flow stratification () relative to the chemostimulus distribution (blue, from measurements in Figure 1b). Cells migrate up the gradient () followed by uniform dispersal as the gradient dissipates (). Degree of cell accumulation is determined from the number of cells, , in a 200 μm wide region on the chemostimulus side (positive; green dashed line) and buffer side (negative; red dashed line), respectively (Seymour et al., 2010; Stocker et al., 2008). (d) The measured cell distribution across the microchannel evolves over time (from c) and is represented as a conditional probability density of cell position, (shown as a kymograph). (e) for V. alginolyticus chemotactic response to serine from a series of SA devices having the same geometry as the MCD observation regions (Figure 1). SA measurements illustrate the transition from positive chemotactic response at high attractant concentration () to no response at low concentration () compared to control () (Altindal et al., 2011). (f) Accumulation index, , for SA measurements from e. (g) measured by the MCD under the same conditions of the SA. (h) measured from g accurately captures the behavior of V. alginolyticus to serine compared to SA results (f). (i) Sørensen similarity metric (Cha, 2007) comparing e and g, which is calculated at each time point and averaged. (j) Comparing MCD and SA peak chemotactic response quantified by max () from f,h. (k,l) in the absence of a chemical gradient (k; Figure 2—figure supplement 1) and for fixed gradients of (l; Figure 2—figure supplement 1b) across each observation channel in the MCD indicates no significant bias. No gradient (k) conditions () were obtained by injecting buffer into the chemical inlet (setting ). Fixed gradient (l) conditions ( of serine) were obtained by injecting of serine into both the chemical and buffer inlets of the dilution layer. Shading in f,h,k,l indicates one standard deviation (N=3). Error bars in i,j are one standard deviation across biological replicates.


