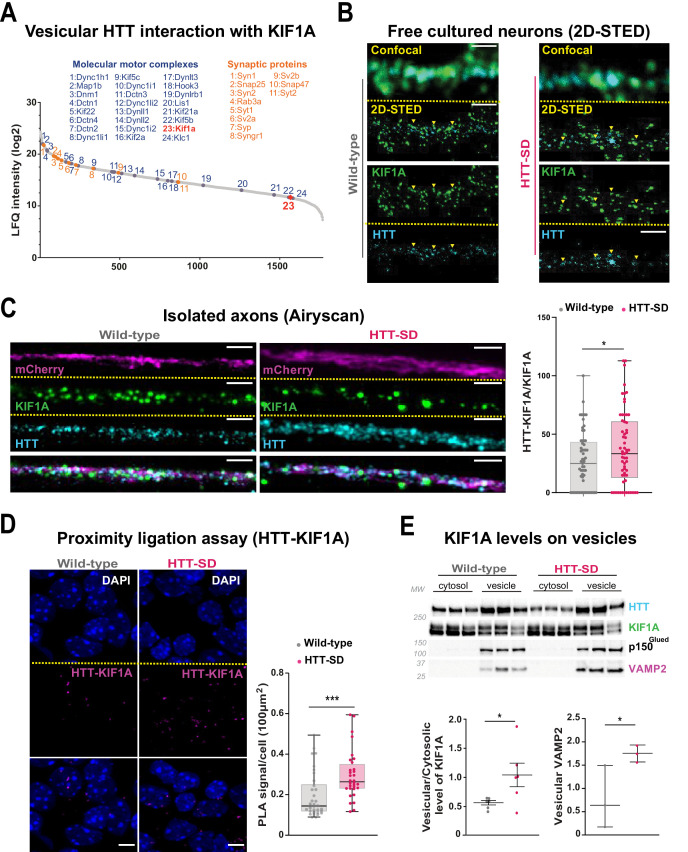
Figure 5. HTT phosphorylation recruits KIF1A on VAMP2-mCherry vesicles.
(A) Mass spectrometry analysis of vesicles purified from mouse brains identifies KIF1A (red) among HTT-associated vesicular proteins. (B) Confocal and two-dimensional stimulated emission depletion (2D-STED) images of free-cultured neurons at day in vitro (DIV) 5 showing the colocalization of KIF1A and HTT. Scale bar: 1 μm. (C) Representative immunofluorescence labeling revealing HTT (cyan), KIF1A (green), and VAMP2-mCherry (magenta) within wild-type (WT) and HTT-SD cortical axons in the long channels of the microfluidic devices. The images were acquired in a specific region of interest and processed by an Airyscan detector (scale bar: 1 µm). Distribution analysis shows that HTT and KIF1A were more likely to colocalize on KIF1A+ vesicles in the HTT-SD condition. The graph represents means ± SEM of three independent experiments reproducing a corticostriatal network of WT or HTT-SD neurons in at least three microfluidic devices per experiment. Significance determined by the Mann-Whitney test (*p<0.05; N=61). (D) Proximity ligation assay (PLA) in WT or HTT-SD neurons, nuclei stained with DAPI. Representative images are from three independent experiments. Scale bar: 10 µm. Significance was determined by the Mann-Whitney test (***p<0.0001; N=32–34). (E) Western blot analysis for HTT, KIF1A (both bands), p150Glued, and tubulin from vesicular fractions from six WT and six HTT-SD brains. Significance was determined using the Mann-Whitney test (*p<0.05).


