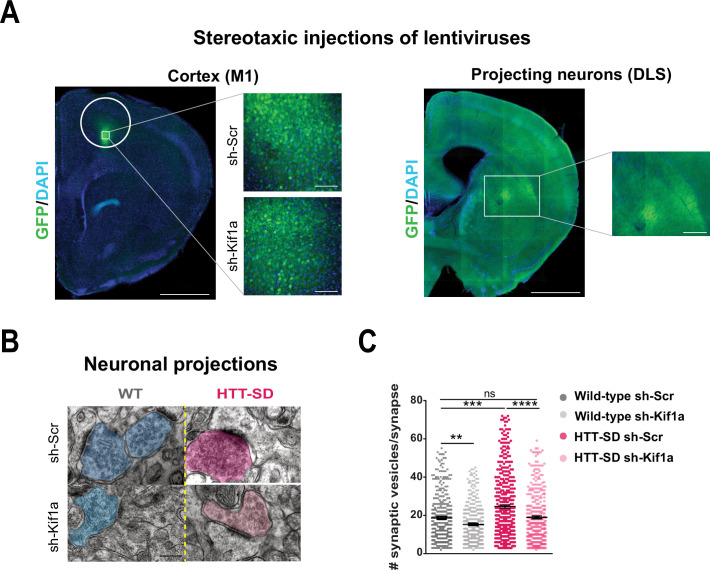
Figure 7. In vivo KIF1A silencing in mice restores the synaptic vesicle (SV) synaptic pool.
(A) Immunolabeling of GFP within the injection site on a slice located at 1.5 mm before the bregma (left). Scale = 1 cm (insets, 100 µm). Immunolabeling of GFP within the projection site on a slice located at –0.3 mm after the bregma (right). Scale = 1 cm (inset, 250 µm). Nuclei are labeled with DAPI. (B) Representative images from electron microscopy of corticostriatal synapses and (C) quantification of the number of SVs at the corticostriatal synapse of three wild-type (WT) male mice injected with either sh-Scr or sh-Kif1a and three HTT-SD mice injected with sh-Scr or sh-Kif1a (**p<0.01, ***p<0.001, ****p<0.0001; N=360 WT sh-Scr synapses, 324 WT sh-Kif1a synapses, 417 HTT-SD sh-Scr synapses, 337 HTT-SD sh-Kif1a synapses). Scale = 200 nm. Histograms represent means ± SEM. Significance was determined using one-way ANOVA followed by Dunn’s multiple comparison test.

