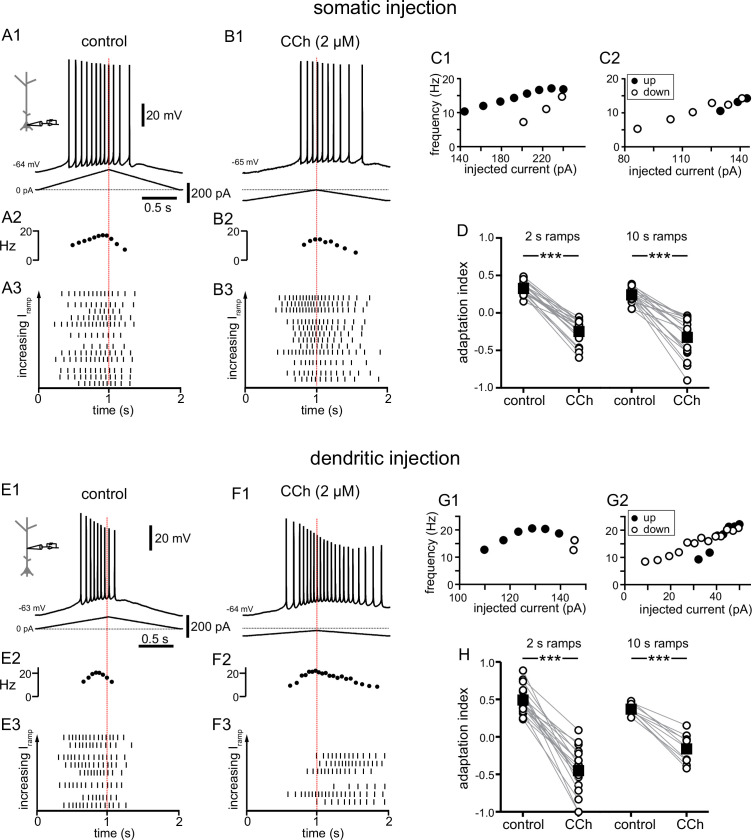
Figure 1. Carbachol shifts the center of mass of firing in response to depolarizing current ramps.
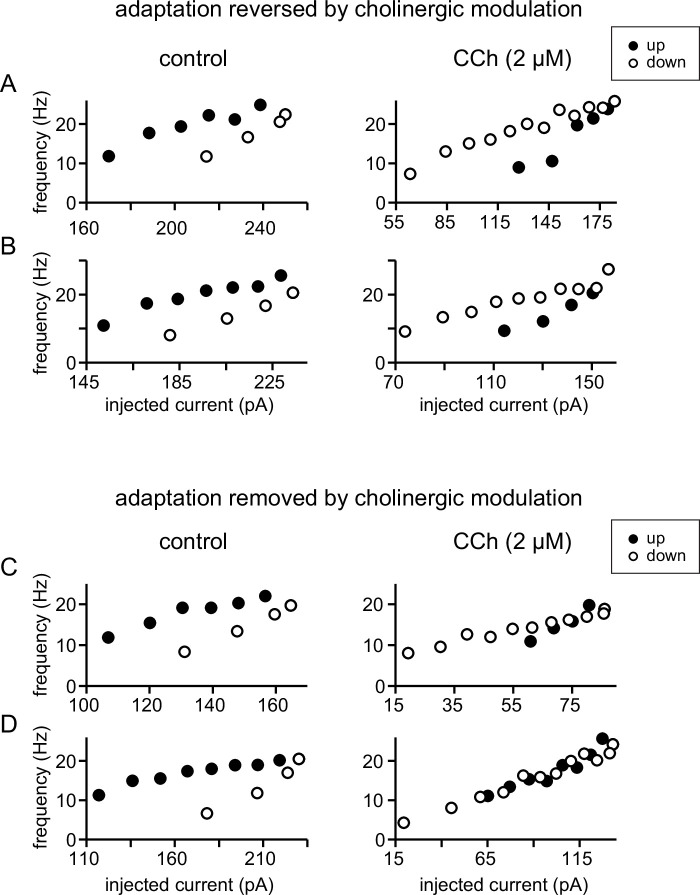
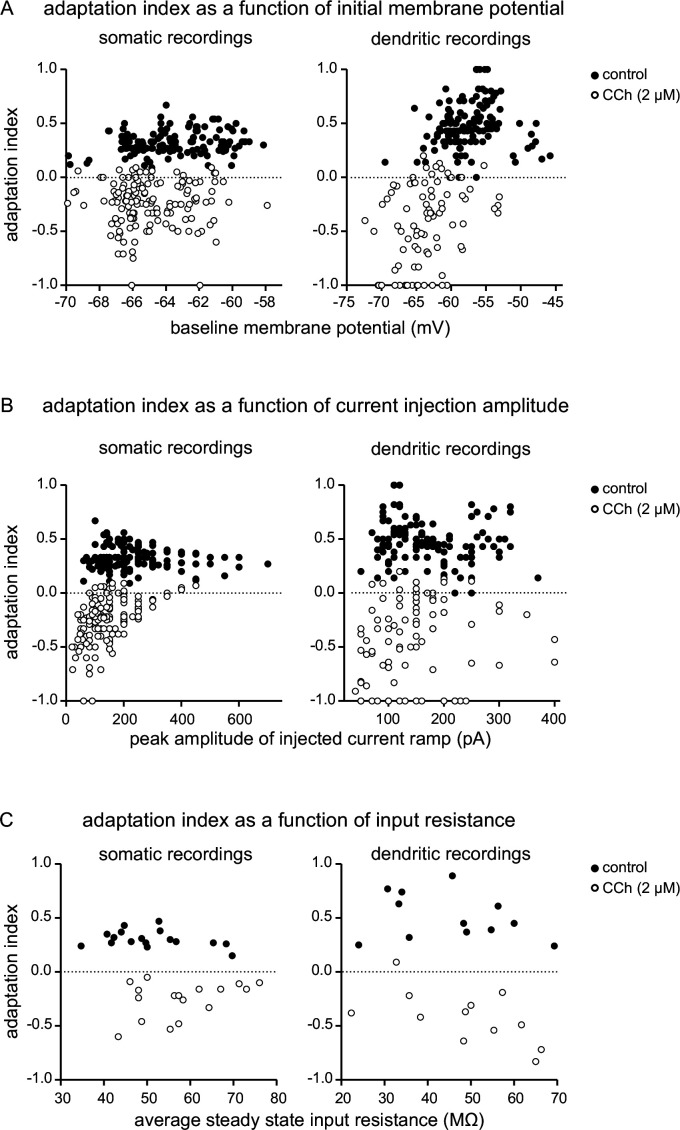
(A) Somatic recording, control. (A1) Voltage trace for a two second triangular current ramp (represented below) injected in the soma. (A2) Instantaneous frequency for example in A1 as it changes along the ramp. (A3) Raster plot of different trials recorded from the same example neuron in A1. The trials are ordered by the amplitude of the peak injected current, from lowest (bottom) to highest (top); trials with the same amount of current injection are clustered together. (B) Somatic recording, carbachol. (B1, B2, and B3) Same as A1, A2, and A3, but during superfusion with 2 µM CCh. (C1) Instantaneous frequency for example in A1, as it changes with injected current. Filled circles represent firing on the up-ramp; open circles, firing on the down-ramp. (C2) Instantaneous frequency for example in B1. A, B, and C are recordings from the same cell. (D) Summary data of the adaptation index for somatic recordings, before and during CCh, for two second ramps (n=21) and ten second ramps (n=19). Open circles connected by gray lines represent indices for individual cells, before and during CCh. Black squares with error bars represent group averages ± SEM. In control, all adaptation indices are positive, indicating more action potentials on the up-ramp. In CCh, most adaptation indices are negative, indicating more action potentials on the down-ramp. (E) Dendritic recording, control. (E1) Voltage trace for a two second triangular current ramp (represented below) injected in the dendrite, approximately 200 µm from the soma. (E2) Instantaneous frequency for E1 as it changes along the ramp. (E3) Raster plot of different trials recorded from same example neuron in E1. (F) Dendritic recording, carbachol. (F1, F2, and F3) Same as E1, E2, and E3, but during superfusion with 2 µM CCh. (G1) Instantaneous frequency for example in E1, as it changes with injected current. (G2) Instantaneous frequency for example in F1. E, F, and G are from the same cell. (H) Summary data of the adaptation index for dendritic ramps, before and during CCh, for two second ramps (n=19) and ten second ramps (n=10). *** p<0.0005, paired t-test. Red dotted lines in the left panels mark the middle of the current injection ramp. Source data in "Figure 1—source data 1". See also Figure 1—figure supplement 1 and Figure 1—figure supplement 2.


