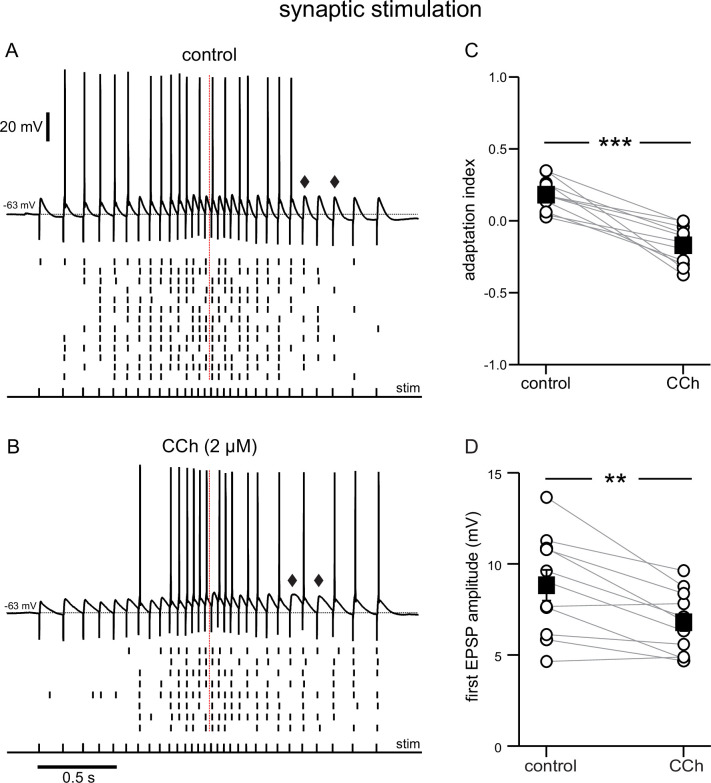
Figure 2. Cholinergic modulation of the response to electrical stimulation of Schaffer collaterals, recorded at the soma.
(A) Top, synaptic response in control conditions to an input frequency that increases and decreases symmetrically, from 6.7 to 25 Hz, as denoted by the pulses, labeled stim. Bottom, Raster plot of multiple trials repeated at the same stimulation intensity. (B) Same as A during superfusion of 2 µM CCh. A and B are from the same neuron, and at the same stimulation intensity. Diamonds in A and B point to a longer EPSP decay time in the presence of CCh. (C) Summary data of the adaptation index for synaptic ramps, before and during CCh. (D) Summary data of the average EPSP amplitude measured during trials where the cells did not fire in response to the first stimulus pulse, before and during CCh. In both cases, open circles connected by gray lines represent indices for individual cells; black squares with error bars represent group averages ± SEM *** p<0.0005, ** p=0.002, paired t-test. Red dotted lines in the panels on the left mark the middle of the synaptic stimulation. Source data in "Figure 2—source data 1".

