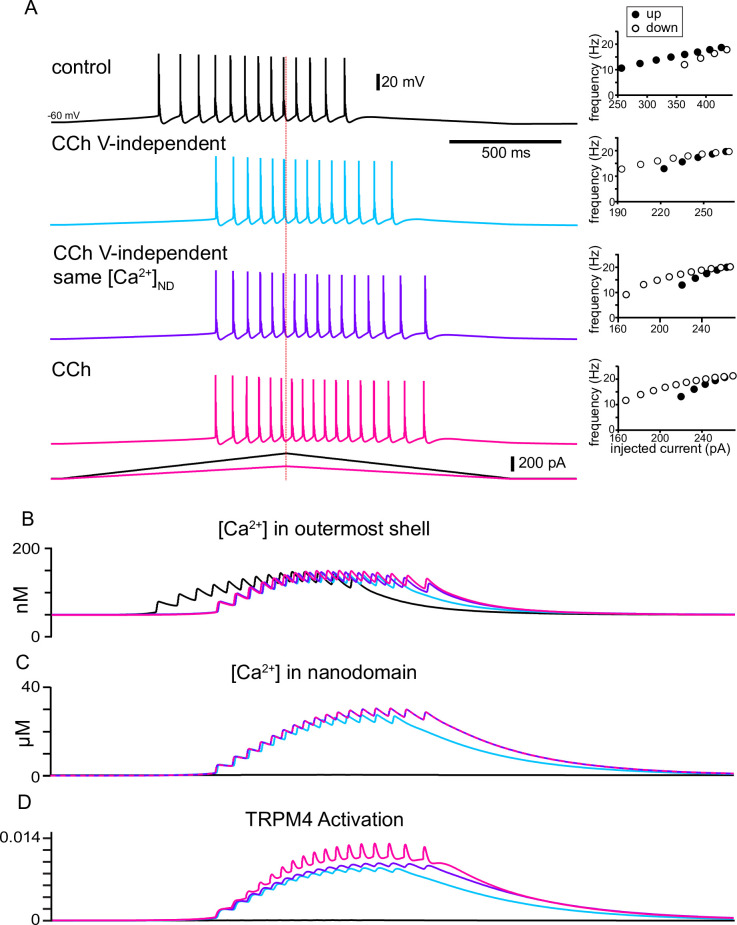
Figure 9. The model explains how activation of TRPM4 channels affects the firing pattern in response to triangular ramps that evoke similar firing frequencies.
(A) Simulated voltage traces (top) during a two second triangular current ramp (just below voltage traces). Insets show the reciprocal of the interspike interval (ISI) plotted as the instantaneous frequency at the ISI midpoint. Vertical dashed red line shows the peak of the current ramp. The slower frequencies at similar values of injected current and fewer ISIs on the down-ramp (open circles) versus the up-ramp (closed circles) in control show hysteresis due to adaptation mediated by long-term inactivation of the sodium channel. TRPM4 channel activation causes the center of mass of firing to be shifted to the right in all other traces compared to control because a nanodomain for TRPM4 activation with special access to Ca2+ was added in simulated CCh. The hysteresis is in the opposite direction because the activation of TRPM4 channels by Ca2+ accumulation obscures and overwhelms adaptation. In the light blue traces, the voltage-dependence of TRPM4 activation was not included, so there is less Ca2+ accumulation in the outer shell in (B) and in the nanodomain in (C), resulting in less activation of TRPM4 channels in (D). In order to isolate the effect of voltage-dependence from that of Ca2+ dependence, the Ca2+ waveforms in all nanodomains were recorded during the full CCh simulation shown in magenta, and played back into each nanodomain Ca2+ during the simulations shown in purple.

