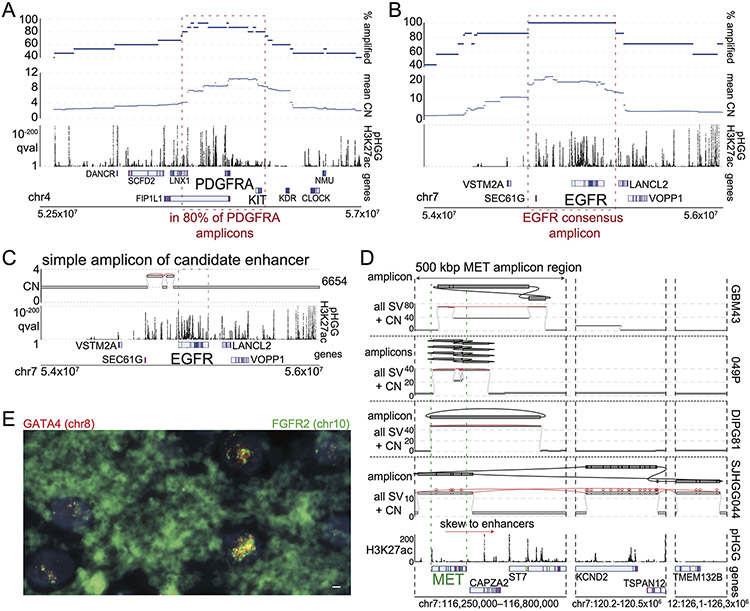
Extended Data Fig. 4. Structures of recurrent RTK amplicons.
(A) Average amplicon profile for all pHGGs with amplifications in the PDGFRA TAD reaching a copy number (CN) of at least four (n = 15 tumors). The top track shows the percentage of those tumors with amplifications (vertical axis) at each location (horizontal axis). The track below shows the average CN across all tumors with amplifications in the PDGFRA TAD. The segments included in the PDGFRA amplicon in 80% of tumors are highlighted in the red box. Most amplicons range over several Mbp, often including KIT. (B) Average amplicon profile for all pHGGs with amplifications in the EGFR TAD reaching at least four copies (n = 7 tumors) displayed as in (A). The segments included in all the EGFR amplicons are highlighted in the red box. The pHGG EGFR amplicons always include upstream enhancers elements around SEC61G. (C) Structure of a simple EGFR-TAD amplicon that encompasses enhancers that are also amplified in all tumors with EGFR amplifications. (D) SVs, CN tracks and reconstructions for all pHGGs with high-level MET amplifications. The observed high-level MET amplicons are a few 100kbp in size. Three out of four MET-amplified pHGGs incorporate a downstream region including an enhancer (see bottom H3K27ac track) into the amplicon. For all four MET-amplified pHGGs possible reconstructions of the extrachromosomal amplicon are shown above the CN and SV track. (A-D) From bottom to top the tracks show: the genes of interest at the location, a q-value H3K27ac track calculated from eight pHGG tumor samples, the CN and SV for the indicated tumor at the location and reconstructions of possible extrachromosomal amplicons if applicable. (E) FISH with probes for the GATA4 locus on chr8 (red) and the FGFR2 locus on chr10 (green) in tissue from a pHGG with SVs within high-level amplicons that connect these two loci. Scale bar indicates 2μm. Representative image from n=200 nuclei.

