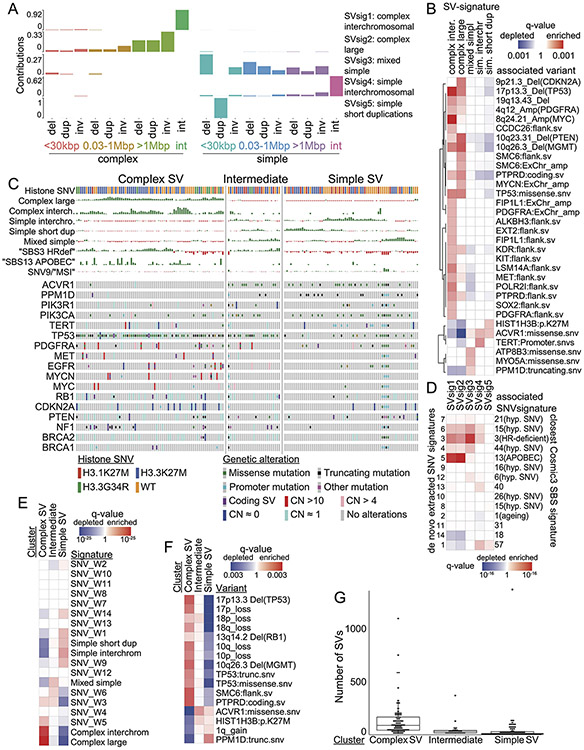
Extended Data Fig. 6. SV signatures in pHGG based on size, SV type and complexity.
(A) The horizontal axis indicates the size and type of SVs. Del stands for deletion, dup for duplication, inv for inversion, and int for interchromosomal rearrangement. The vertical axis indicates the fraction of SVs within each signature that are contributed by each SV type (based on n=179 tumors). (B) The statistical significance of positive (enriched) and negative (depleted) associations (Wilcoxon Tests) between each SV signature and of all recurrently altered somatic genetic alterations that are documented in the Cancer Gene Census46. (C) Consensus clustering of the normalized SNV and SV signature activities in each tumor sample (columns). Rows indicate signature activities (top) and potentially oncogenic variants (bottom). (D) Correlations between SV and SNV signatures. Signature labels from this analysis are indicated on the left; the nearest COSMICv3 signatures are indicated on the right, with their proposed mechanisms in parentheses. Complex-SV signatures show a close correlation with APOBEC and homologous recombination deficiency SNV signatures (SBS3). q-values are based on Spearman rank correlations. (E) Enrichment analysis for signature activities in each cluster from panel B. FDR q-values are based on Wilcoxon tests. (F) Significance of signature cluster associations for all variants with correlations reaching q < 0.1; q-values are based on Fisher’s exact tests. Tumors in the complex-SV clusters are enriched for copy-number changes in cancer genes and SNVs in TP53, whereas simple-SV pHGGs tend to exhibit SNVs in different cancer genes. (G) Number of SVs per tumor in each cluster (n=179 tumors). All differences are significant to q<0.003 by Wilcoxon tests, center line of the boxplot indicates the median, bounds of the box the 25th and 75th percentiles and whiskers extend from the box to the largest or smallest value no further than 1.5xIQR.

