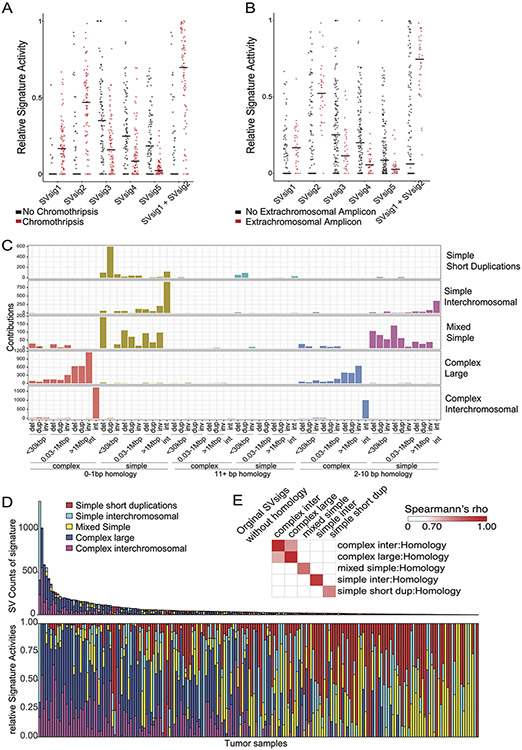
Extended Data Fig. 7. Chromothripsis and homology length at the breakpoints in size/SV-type/complexity SV signatures.
(A-B) SV signature activities in samples that contain or lack (A) chromothriptic regions or (B) extrachromosomal amplifications (n=179 tumors, center line indicates the median). (C) SV signature analysis including homology length channels reveals five signatures. The horizontal axis indicates the size and type of SVs. Del stands for deletion, dup for duplication, inv for inversion, and int for interchromosomal rearrangement. The vertical axis indicates the amount of SVs within each signature that are contributed by each SV type. (D) SV signature activity in every tumor of the homology SVsigs. Tumors with higher SV counts on the left show complex-SV signature activity whereas tumors with lower SV counts on the right show a mix of simple-SV signatures mimicking the SVsig distribution without homology information (n=179 tumors). (E) By sample correlation between SVsigs with and without homology

