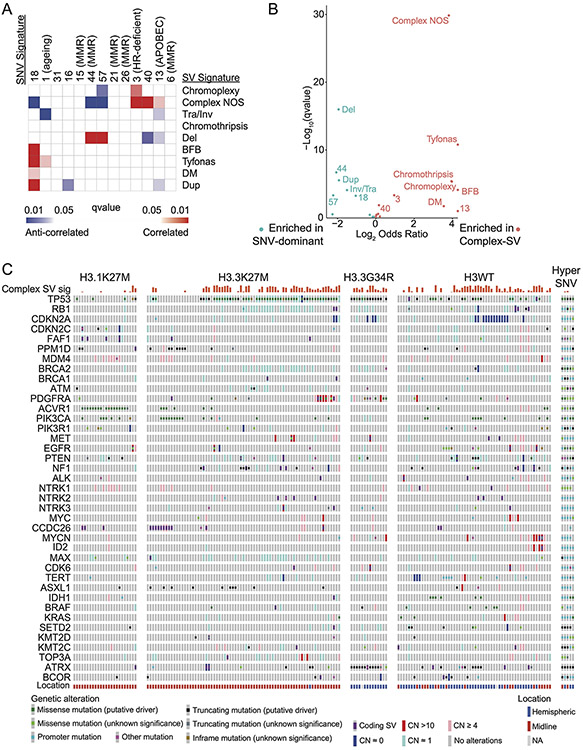
Extended Data Fig. 8. Associations between SV-defined groups and extended co-mut plot split by histone groups.
(A) Correlations between SVs and SNV signatures in included in the COSMICv3 signatures database. SNV signatures with well-established links to mechanisms are indicated in parentheses. These include mismatch repair (MMR), homologous recombination (HR) deficiency, APOBEC and aging. q-values were calculated using Spearman rank correlations. (B) Enrichment analysis for signature activities present in Complex-SV and SNV-dominant clusters. q-values were calculated using Wilcoxon tests. (C) Co-mut plot of the 176/179 (98.3%) tumors with somatic variants in at least one well-known oncogene. Columns represent tumors, ordered within histone mutation-defined subgroups by hierarchical clustering of all potential driver variants. The top two rows show signature metadata.

