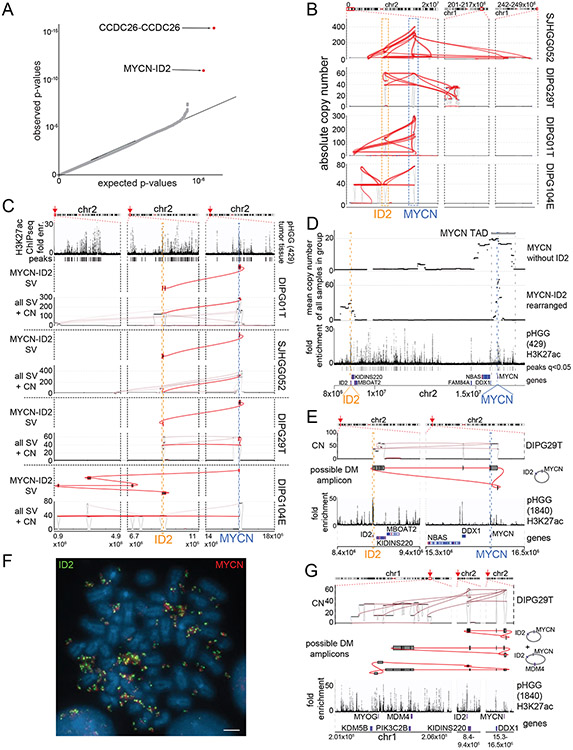
Figure 2. Significantly recurrent juxtapositions: MYCN-ID2.
(A) Quantile-Quantile plot indicating the significance of juxtapositions between pairs of genomic loci. SVs that reached statistical significance are depicted in red (based on n=179 tumors). B) SVs (red lines) involving MYCN and ID2 in samples with MYCN-ID2 rearrangements, and the number of copies at each connected locus (vertical axis). The dashed boxes indicate loci encompassing ID2 and MYCN. (C) SV maps as in panel B, with SVs juxtaposing ID2 and MYCN highlighted in red. The top track indicates H3K27ac marks in a pHGG without a known MYCN-ID2 rearrangement, showing a strong enhancer within ID2. In each case, the MYCN-ID2 juxtaposition reduces the somatic distance MYCN and ID2 (each indicated by a dashed line) from 7 Mbp to less than 700kbp. (D) MYCN amplicons in tumors without ID2 amplification (top track) incorporate a larger fraction of the MYCN TAD (mean of 60%, n = 4 tumors) relative to MYCN amplicons in tumors with MYCN-ID2-SV (second track; mean of 23%, n = 4 tumors). As a result, the former tend to include more loci with H3K27ac enrichment (third track) from the MYCN-TAD; significantly enriched H3K27ac peaks (q-value < 0.01) are indicated with black bars between the H3K27ac fold enrichment and the gene track. (E) Example of the simplest possible reconstruction of a circular extrachromosomal amplicon containing MYCN and ID2 from a single DMG. The top track shows copy-number and SVs, the middle track indicates the reconstructed topology, and the bottom track shows H3K27ac binding at the indicated loci in a different pHGG. (F) Metaphase FISH of a pHGG cell line with the MYCN-ID2 rearrangement showing its location on an extrachromosomal amplicon. The ID2 and MYCN locus-targeting probes are colored in green and red, respectively. Scale bar indicates 2μm. Representative image from n=20 metaphases. (G) The chr1 loci connected to the MYCN-ID complex in this DMG. Short-read reconstructions allow for several extrachromosomal amplicons incorporating MYCN-ID2 and MDM4. The difference in the copy number could be explained either by a mix of amplicons containing respectively MYCN-ID2 alone and MYCN-ID2-MDM4 or by more complex amplicons incorporating multiple copies of MYCN-ID2 for each copy of MDM4. Tracks as in (E).

