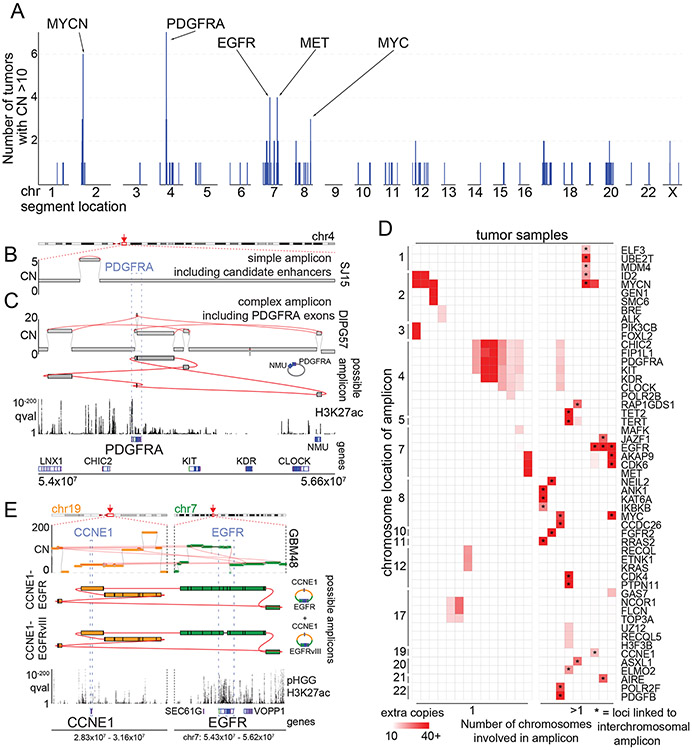
Figure 3. High-level amplicons.
(A) For each genomic locus (horizontal axis), the number of tumors containing a high-level (CN>10) amplicon is indicated (vertical axis). SRBs are highlighted at the top. (B-C) Simple and complex SVs exhibit distinct mechanisms to active PDGFRA. The top and bottom tracks indicate copy-numbers and the significance of H3K27ac enrichment (as calculated from eight pHGGs), respectively. SVs are highlighted in red. Selected gene loci are indicated on the bottom. (B) A simple amplicon of a region with known18,44 PDGFRA enhancers. (C) A complex high-level PDGFRA amplicon, displayed as in panel (B) with the addition of a track (second from top) indicating the topology of the amplicon. The complex-SV cluster around PDGFRA connects several segments on chr4, which are amplified to ten absolute copies. The SV calls support the reconstruction of an extrachromosomal amplicon incorporating PDGFRA exons and these segments. (D) Cancer genes involved in high-level amplicons (>10 copies) within the cohort. 9/23 tumors (grouped on right) contain high-level amplicons encompassing loci from two or more chromosomes. These linked loci are marked by *. The color of each cell represents the number of extra copies due to the amplicon. (E) Example of a tumor with an extrachromosomal amplicon including two oncogenes from different chromosomes. This tumor shows a cluster of SVs connecting the EGFR and CCNE1 loci. The regions of both oncogenes are amplified to different CNs but in both cases reach several dozen absolute copies. (top) The complexity of the SVs allows for the reconstruction of several possible extrachromosomal amplicons. The CN differences in the bulk profile (middle) could be explained by either a mix of different circles or by more complex circles incorporating some segments repeatedly. The SV calls also reveal that a small fraction of the EGFR amplicons in this patient already show the EGFRvIII variant. The bottom two tracks show the genes of interest at the location and q-value H3K27ac track calculated from eight pHGG tumors.

