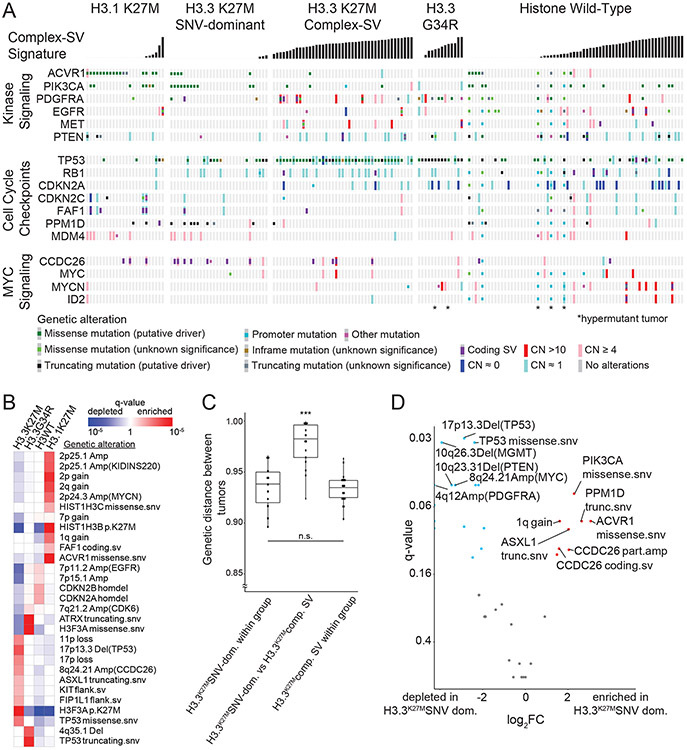
Figure 5. Overview of somatic variants and associated features within subgroups defined by histone mutations.
(A) Co-mut plot of the 176/179 (98.3%) tumors with somatic variants in at least one well-known cancer gene. Columns represent tumors, ordered within histone mutation-defined subgroups by increasing activity of the complex SV signatures. Rows represent cancer genes that harbor somatic variants, grouped by pathways. Type of genetic alterations are depicted by the colors shown in the key below the comut plot. *indicates hypermutant tumors. (B) Heatmap indicating significance of histone subgroup associations for all variants with correlations reaching q < 0.05 (based on Fisher’s exact tests) within any subgroup. Red indicates enrichment and blue indicates depletion. Shading reflects q values as shown in the legend. (C) Jaccard distances based upon the variants in each tumor (vertical axis), for pairs of tumors within the H3.3K27M SNV-dominant group (left column), within the H3.3K27M Complex-SV group (right column) or paired between these groups (middle column). H3.3K27M tumors were considered to be in the Complex-SV group if complex SV signatures comprised more than 20% of its SV signature activity. *** denotes q=5.8x10⁻⁸ for within-group H3.3K27M SNV-dominant vs. between groups and q=1.3x10⁻¹⁰ for within-group H3.3K27M Complex-SV vs. between groups by a two-sided Wilcoxon test, n = 102 DMGs. Center line of the boxplot indicates the median, bounds of the box the 25th and 75th percentiles and whiskers extend from the box to the largest or smallest value no further than 1.5xIQR. (D) Volcano plot indicating the significance (vertical axis; FDR-corrected Fisher’s exact tests) of associations in H3.3K27MSNV-dominant [n=30 DMGs] relative to H3.3K27MComplex-SV [n=43 DMGs], for all genetic variants observed in at least 10% of tumors in one subgroup. Variants enriched or depleted to q<0.15 are highlighted in red on the right or in blue on the left, respectively.

