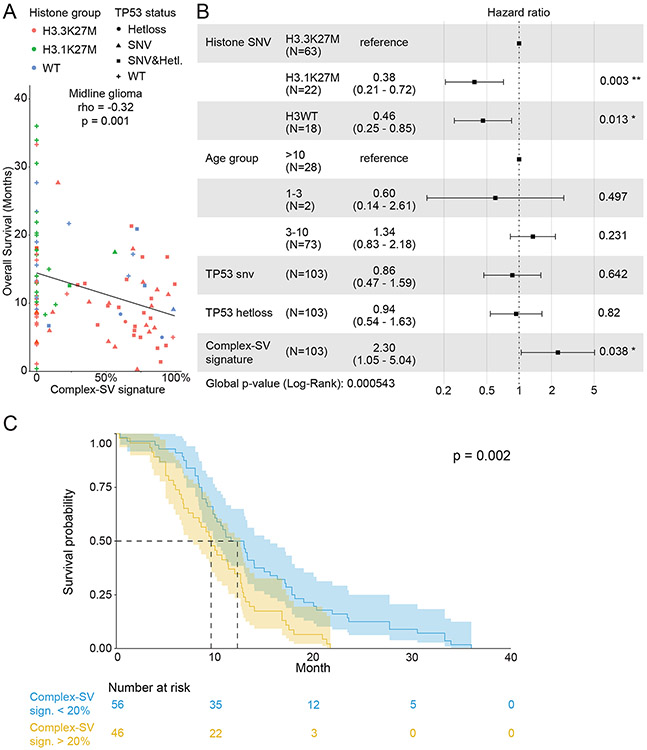
Figure 7. Association between the complex SV signatures and overall survival in midline gliomas.
(A) Associations between the fraction of SV signature activity attributed to complex SV signatures and overall survival for all midline gliomas (n= 103; rho = −0.32 and p=0.001, two-sided Spearman correlation test). (B) Cox proportional hazards analysis incorporating histone group, age, TP53 status and the combined complex SV signatures. Error bars show the 95% confidence interval of the hazard ratio. (C) Kaplan-Maier plot of a univariate analysis of the association between the complex SV signatures and overall survival, in which tumors were classified as Complex-SV if complex SV signatures contributed more than 20% of all SV signature activity. The number of patients in each group is indicated below the plot. The p-value represents a log-rank test. Error bands show the 95% confidence interval.

