
Table 1.
Continuity Measures, Examples, and Calculation
| Measure and Examplesa | Calculation |
|---|---|
| Usual provider of care (this measure is based on the fraction of contacts with a particular family physician) Example A: 6/10 = 0.60 Example B: 6/10 = 0.60 |

|
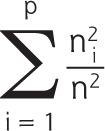
| Herfindahl Index (this measure is based on the fraction of contacts with all family physicians) Example A: (62/102) + (42/102) = 0.52 Example B: (62/102) + (32/102) + (12/102) = 0.46 |
|
| Bice-Boxerman Index (also known as Continuity of Care Index; this measure is based on the fraction of contacts with all family physicians who had at least several contacts) Example A: [(6 × 5)/(10 × 9)] + [(4 × 3)/(10 × 9)] = 0.47 Example B: [(6 × 5)/(10 × 9)] + [(3 × 2)/(10 × 9)] + [(1 × 0)/(10 × 9)] = 0.40 |

|
p = total number of different family physicians; n = total number of contacts with any family physician; ni = number of contacts with family physician i.
a
Example A: the patient had 10 contacts, of which 6 were with family physician A and 4 were with family physician B. Example B: the patient had 10 contacts, of which 6 were with family physician A, 3 were with family physician B, and 1 was with family physician C.