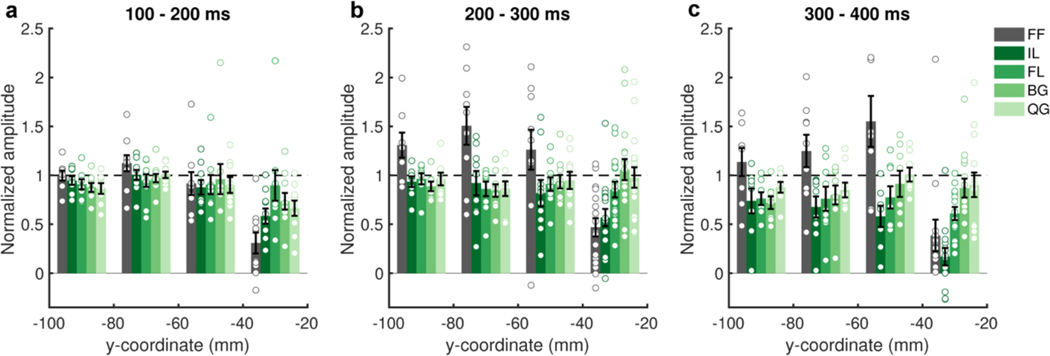
Extended Data Figure 2. Spatiotemporal mapping of selectivity to hierarchical orthographic stimuli.
Word-amplitude normalized selectivity profiles grouped in 20 mm intervals along the y (antero-posterior) axis in Talairach space for three consecutive time windows (20 patients). Within each time window, electrodes with >20% activation above baseline in response to words were utilized. Averaged within patient. Standard errors represent between patient variability. Individual data points are overlaid. Horizontal dashed lines represent word response.

