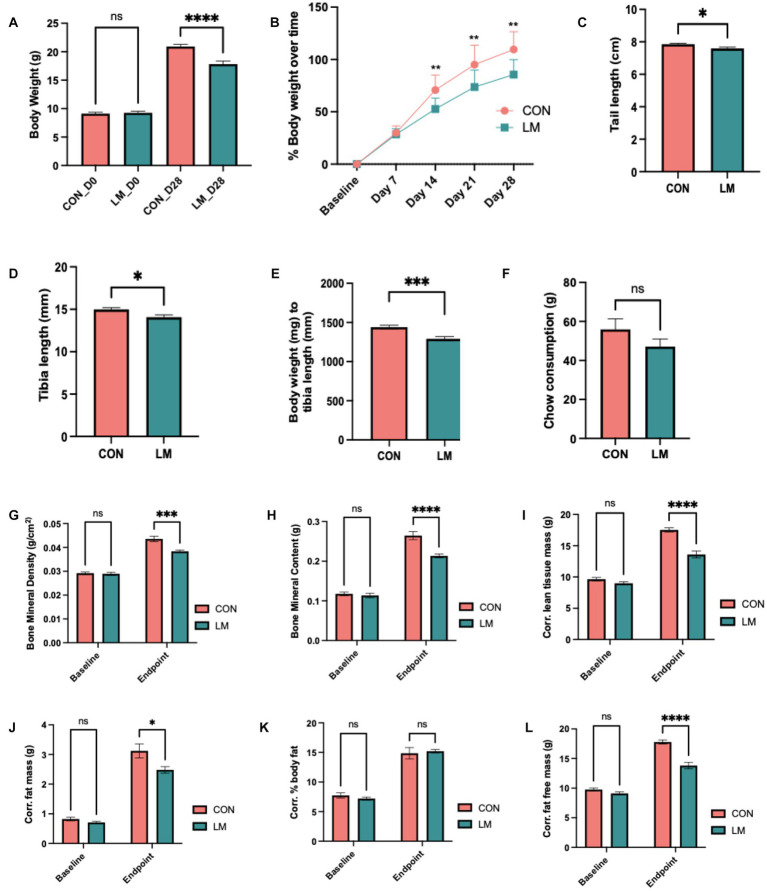
Figure 2.
Impact of early life multiple micronutrient deficiencies on growth and body composition. (A) body weight, (B) percent weight gain over time, (C) average chow consumption (D) tail length (E), tibia length (F) bodyweight/tibia ratio revealed stunting in the LM mice. Body composition assessed by DEXA scan Day 0 (i.e., baseline) and Day 28 showed lower (G) bone mineral density, (H) bone mineral content, (I) corrected lean tissue mass, (J) corrected fat free mass, (K) corrected percent body fat (ns), and (L) corrected fat mass at day 28. Data analyzed using Student’s t-test, and body composition using two-way ANOVA with Šidák multiple comparison testing. All data represented as mean ± SEM and p values expressed as *p < 0.05, **p < 0.01, ***p < 0.001, ****p < 0.0001, ns, not significant p > 0.05.

