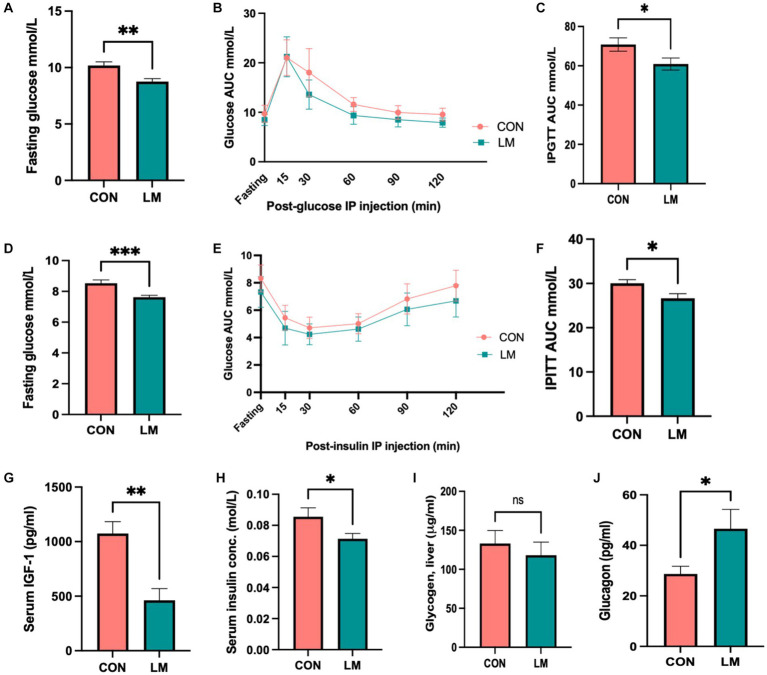
Figure 3.
Glucose metabolism dysregulated in mice fed the low-micronutrient diet. (A–F) Fasting glucose, intraperitoneal glucose tolerance test (IPGTT) area under the curve (AUC), intraperitoneal insulin tolerance test (IPITT) AUC. (G–J) IGF-1, serum insulin, liver glycogen storage periodic acid-Schiff stain, (data not shown), glycogen assay and glucagon were assessed. Data shown here are from two independent experiments of 10 mice/group. Glucose and Insulin data are analyzed using ANOVA with post hoc Tukey’s test. All other data analyzed using Student’s t-test and values expressed in mean ± SEM. *p < 0.05, **p < 0.01, ***p < 0.001, ****p < 0.0001, ns, not significant p > 0.05.

