
Fig. 2. Relative environmental footprint from GHG emissions of diet groups in comparison to high meat-eaters (>100 g d−1).
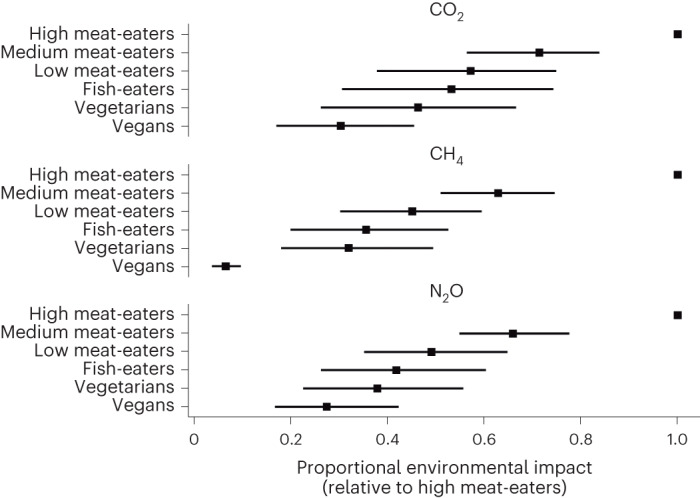
Uncertainty intervals are 2.5th to 97.5th percentiles of a Monte Carlo analysis (n = 1,000).
Official websites use .gov
A
.gov website belongs to an official
government organization in the United States.
Secure .gov websites use HTTPS
A lock (
) or https:// means you've safely
connected to the .gov website. Share sensitive
information only on official, secure websites.
Uncertainty intervals are 2.5th to 97.5th percentiles of a Monte Carlo analysis (n = 1,000).