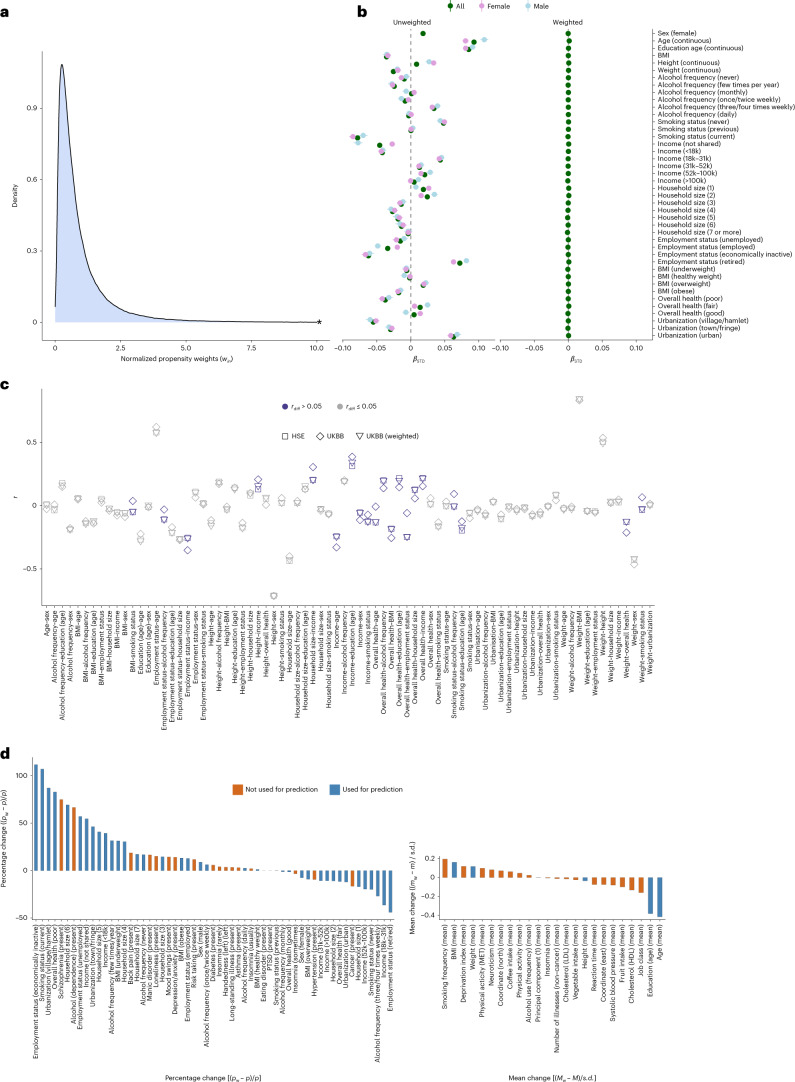
Fig. 2. Performance of the UKBB probability weights.
a, Truncated (*) density curves of the normalized probability weights (win) for UKBB participants, ranging from 0.02 to 50.01. b, Standardized coefficients (and 95% confidence intervals) of variables predicting UKBB participation (HSE = 0; UKBB = 1) in univariate logistic regression models. Coefficients are provided for all UKBB participants and for males and females separately. c, Correlation coefficients among all auxiliary variables within the UKBB (obtained from weighted and unweighted analyses) and within the HSE. Highlighted in blue are results where the coefficients between the UKBB (rUKBB) and the reference sample (rHSE) deviated (rdiff > 0.05, where rdiff = |rHSE − rUKBB|). d, Percentage change (for categorical variables) and change in means as a function of weighting, obtained for a number of health-related UKBB phenotypes, including the auxiliary variables (blue) and variables not used to construct the weights. Percentage change was estimated as the difference between the weighted (pw) and unweighted proportion (p), divided by the unweighted value ((pw − p) / p × 100). Change in means was expressed as a standardized mean difference, estimated as the difference between the unweighted mean (m) and the weighted mean (mw), divided by the unweighted standard deviation (mw − m/s.d.).

