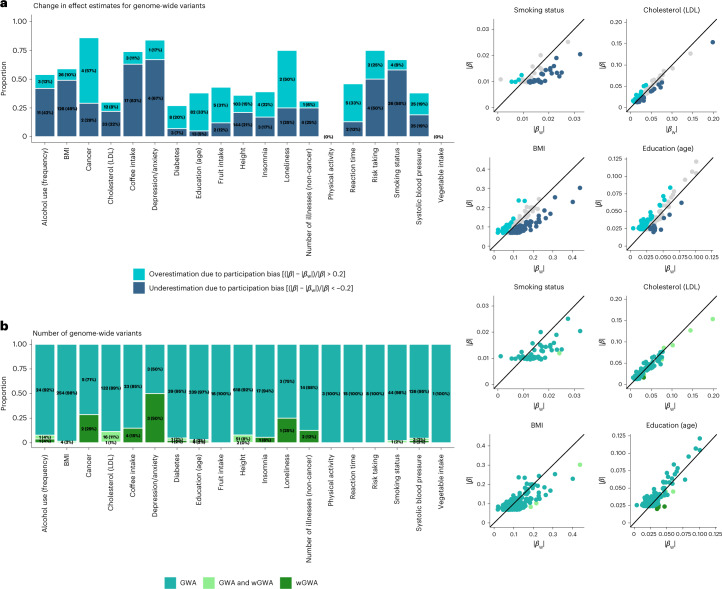
Fig. 3. SNP estimates from weighted and unweighted genome-wide analyses.
a,b, Summary of the comparison between SNP effects obtained from wGWA and standard GWA analyses on 19 traits. Panel a summarizes the proportions of overestimated and underestimated SNP effects as a result of participation bias. Shown in b are the numbers and proportions of SNPs reaching genome-wide significance in standard GWA, wGWA or both (GWA and wGWA). The scatter plots to the right plot the weighted (|𝛽w|) against the unweighted (|𝛽|) SNP effects for four selected traits.

