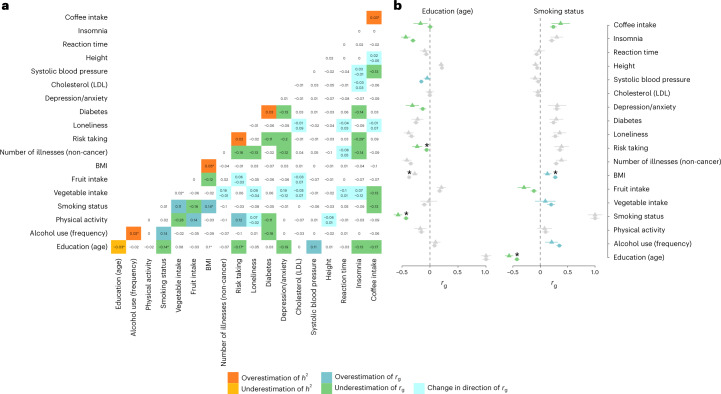
Fig. 5. Weighted SNP heritability and genetic correlation estimates.
a, Differences in SNP heritability () and genetic correlations (rg,DIFF = |rg| − |rg,w|) obtained from weighted and standard GWA analyses. The diagonal shows the differences in SNP heritability, where biases leading to overestimation ( > 0.02) are plotted in orange and biases leading to underestimation ( < −0.02) are plotted in yellow. The off-diagonal highlights overestimated genetic correlations (rg,DIFF > 0.1) in blue and underestimated genetic correlations (rg,DIFF < −0.1) in green. Tiles coloured in turquoise index genetic correlations where rg and rg,w show opposite directions (with rg printed at the top and rg,w printed at the bottom of the tile). b, Estimates of genetic correlations (rg shown as circles; rg,w shown as triangles) and the corresponding 95% confidence intervals for two selected traits. The asterisks indicate estimates showing significant differences (PFDR < 0.05). All P values are from two-sided tests and are corrected for multiple testing using FDR correction (controlled at 5%).

