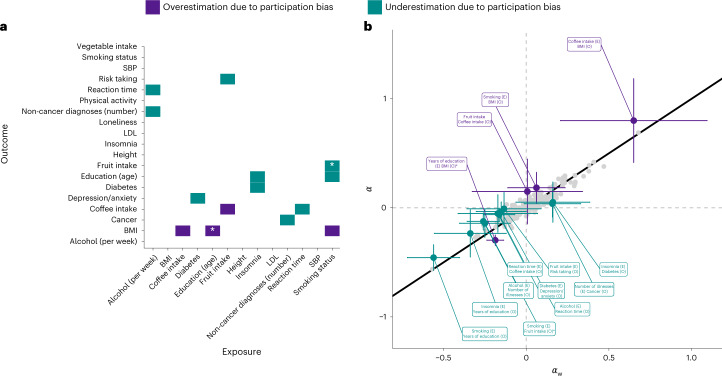
Fig. 6. Effect of participation bias on MR estimates of exposure–outcome associations.
a,b, Summary of results obtained from weighted () and standard () MR. MR estimates subject to overestimation () as a result of participation bias are highlighted in violet. MR estimates subject to underestimation () are highlighted in cyan. The asterisks highlight results where and showed significant (PFDR < 0.05) differences. The error bars (b) indicate the 95% confidence intervals corresponding to and . All P values are from two-sided tests and are corrected for multiple testing using FDR correction (controlled at 5%).

