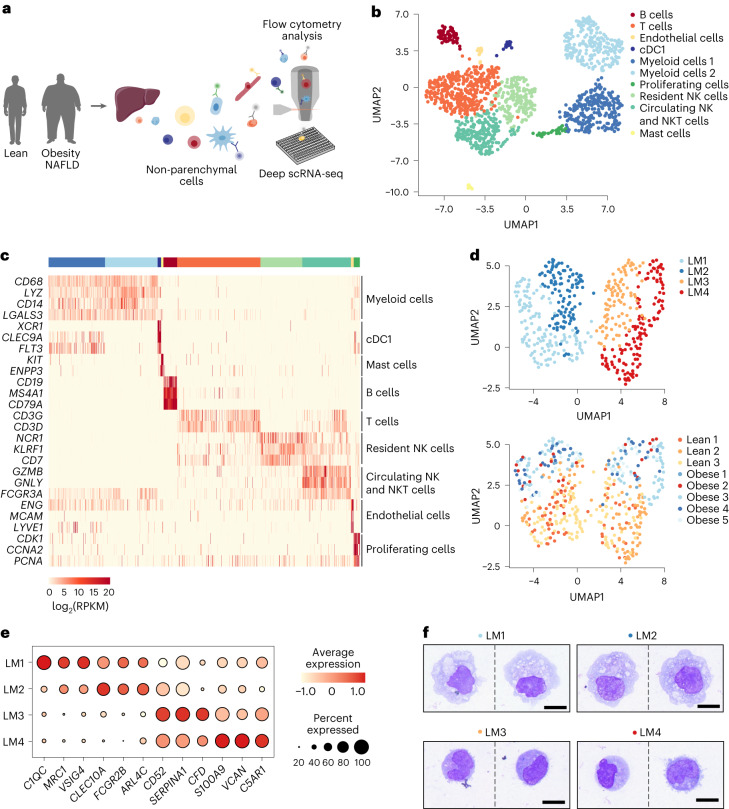
Fig. 1. Identification of distinct LM cell populations in livers of lean humans and humans with obesity.
a, Experimental outline: human NPCs are isolated from livers of lean patients and patients with obesity. NPCs are then single-cell sorted using an antibody panel with 11 markers to record the expression of cell-surface proteins for individual cells, followed by single-cell transcriptomic profiling. b, Uniform manifold approximation and projection (UMAP) visualization of NPCs from lean (n = 3) individuals and individuals with obesity (n = 5); colors indicate cell cluster. Each symbol represents a single cell. c, Gene expression (log2(RPKM)) of markers for each cell type. RPKM, reads per kilobase of exon model per million mapped reads. d, UMAP visualization of LM cells from lean individuals (n = 3) and individuals with obesity (n = 5) colored by subpopulations (top) and colored by individual donors (bottom). e, Dot plot of marker genes significantly differentially expressed by each individual myeloid cell subpopulation. Color intensity indicates expression level, and dot size indicates gene expression frequency (percentage of cells expressing the gene). f, Representative images of cytospins stained with Wright-Giemsa of respective LM cell population, sorted from one lean individual. Scale bar, 10 µm. Illustrations in a were partly created using components adapted from Servier Medical Art, provided by Servier, licensed under a Creative Commons Attribution 3.0 unported license.

