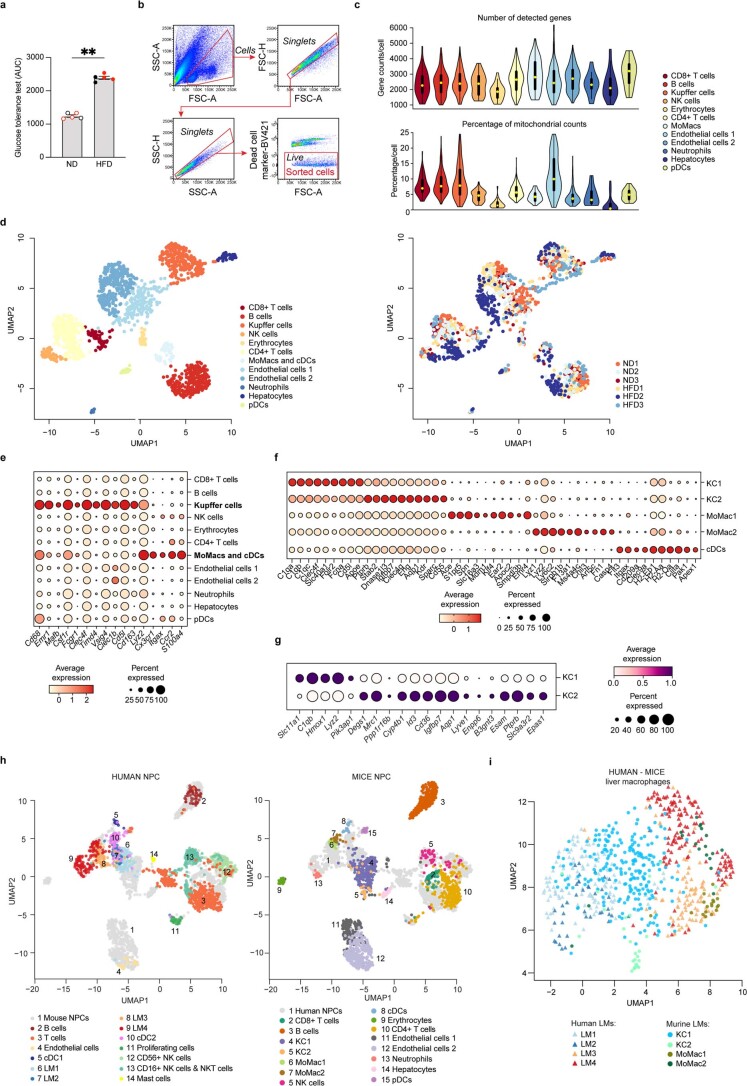
Extended Data Fig. 5. Characterisation and annotation of murine liver macrophages.
a, Glucose tolerance in murine livers (n=5 per condition; P=0.0079), red colour indicates mice used for scRNA-seq. b, Gating scheme for sorting of NPCs from lean mice (n=3) and mice with obesity (n=3) for scRNA-seq. Sorted cells were gated as live, single cells. c, Violin plots of the number of detected genes (left) and the percentage of mitochondrial genes (right) across non-parenchymal cells from lean (n=3) and NAFLD (n=3) murine livers. Yellow dot indicates the median, bold line indicates the interquartile range and thin line displays the 1.5x interquartile range. d, UMAP visualization of NPCs from lean mice (n=3) and mice with obesity (n=3); colours indicate cell cluster (left) and individual mouse donors (right). Each symbol represents a single cell. e, Dot plot of gene expression of previously published markers of Kupffer cells and monocyte-derived macrophages. Colour intensity indicates expression level and dot size indicates gene expression frequency (percentage of cells expressing the gene). f, Dot plot of differentially expressed genes for each myeloid cell subpopulation. g, Dot plot of differentially expressed genes for the Kupffer cell 1 (KC1) and Kupffer cell 2 (KC2) subpopulations. h, Single cell integration of human and mouse scRNA-seq data of NPCs and i, LM cells. Data are presented as mean ± s.e.m. P values were calculated by two-tailed Mann-Whitney test. **p < 0.01. AUC, area under the curve; ND, normal diet; HFD, high fat diet; MoMacs, monocyte-derived macrophages.

