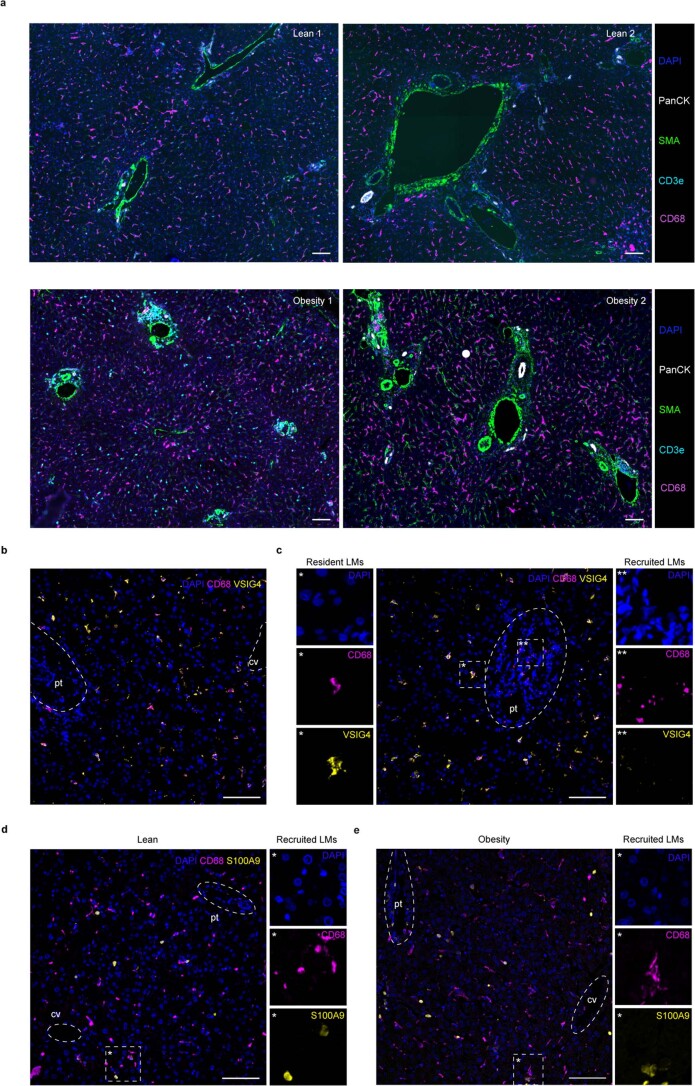
Extended Data Fig. 8. Characterisation of human liver myeloid cell localisation.
a, Representative immunofluorescence images of human livers from lean (n=2) and individuals with obesity (n=2) imaged with Phenocycler, displaying region of interest highlighting five markers (DAPI, PanCK, SMA, CD3e, CD68) that are coloured according to the panel to the right. Scale bar, 100µm. b-c, Representative immunofluorescence image of tissue localization of resident (CD68+VSIG4+) and recruited (CD68+VSIG4-) myeloid cells in human livers. Regions containing portal tracts (pt) and central vein (cv) are highlighted in the image by dashed white lines. Images are representative of 4 individuals. Scale bar, 100µm. d-e, Representative immunofluorescence image of tissue localization of recruited (CD68+S100A9+) myeloid cells in livers from lean and individuals with obesity. Regions containing portal tracts (pt) and central vein (cv) are highlighted in the image by dashed white circles. Scale bar, 100µm. Images are representative of 5 lean individuals and 4 individuals with obesity. LMs, liver myeloid cells; cv, central vein; pt, portal tract.

