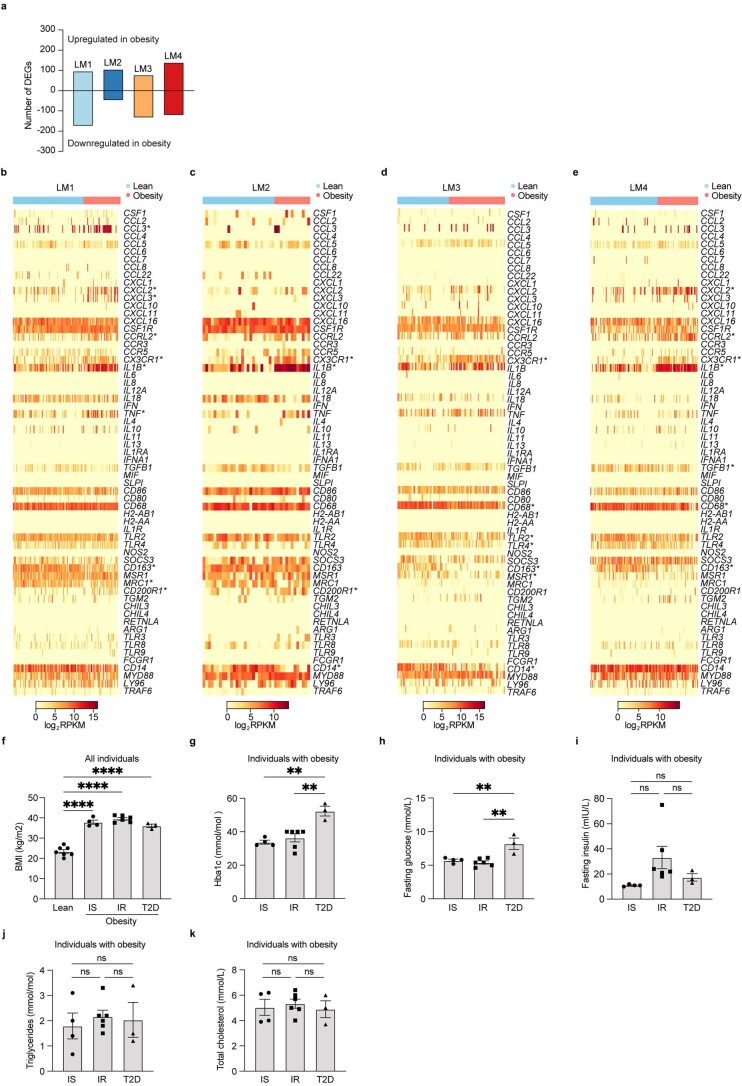
Extended Data Fig. 9. Characterisation of liver myeloid cells in obesity.
a, Number of significantly regulated genes with obesity in each LM cell subpopulation (Supplementary Table 9). b-e, Heatmap of gene expression (log2 RPKM) of chemokines, chemokine-receptors, cytokines, M1 and M2 markers, and pattern recognition receptors in LM cell populations with obesity. Symbol indicates significantly regulated genes (adjusted P < 0.01). f, Body mass index (BMI) of lean individuals (n=7) and individuals with obesity (n=13) (lean vs IS P<0.0001, lean vs IR P<0.0001 and lean vs T2D P<0.0001). g, Haemoglobin A1c (HbA1c) levels in patients with obesity (n=13; IS vs T2D P= 0.0014 and IR vs T2D P=0.0024). h, Fasting glucose (IS vs T2D P=0.0057 and IR vs T2D P=0.0015) and i, insulin levels in patients with obesity (n=13). j, Triglyceride levels in the circulation of patients with obesity (n=13). k, Total cholesterol levels in patients with obesity (n=13). Data are presented as mean ± s.e.m. P values were calculated by one-way ANOVA with adjustment for multiple comparisons (f-k). **p < 0.01 and ****p < 0.0001. DEGs, differentially expressed genes; Reads per kilobase of exon model per million mapped reads, Reads Per Kilobases Million; IS, insulin sensitivity; IR, insulin resistance; T2D, type 2 diabetes; BMI, body mass index; ns, not significant.

