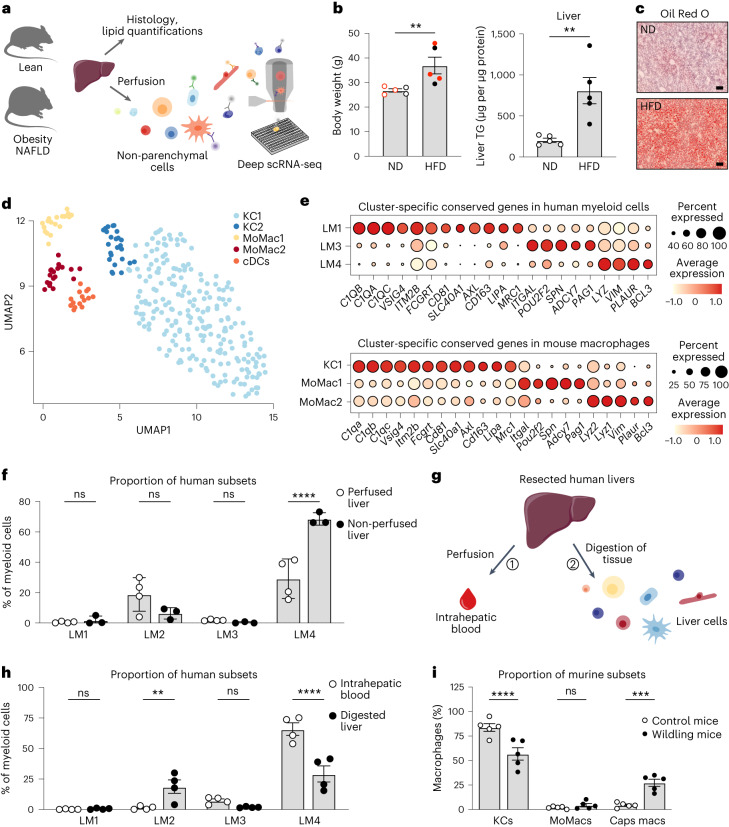
Fig. 2. Human–mouse conservation of the LM cell populations.
a, Experimental outline: livers from lean and obese mice on a high-fat diet for 9 weeks were either collected for histology and lipid quantifications or perfused to isolate murine NPCs. NPCs were single-cell sorted using an antibody panel with ten markers to record the expression of cell-surface proteins for individual cells and used for single-cell transcriptomic profiling. b, Body weight (n = 5 per group; P = 0.0079) and lipid (triglyceride, TG) content in murine livers (n = 5 per group; P = 0.0079). Red indicates mice used for scRNA-seq. ND, normal diet; HFD, high-fat diet. c, Representative images of lipid staining with Oil Red O of murine livers (n = 3 per group). Scale bar, 50 µm. d, UMAP visualization of liver myeloid cells from lean (n = 3) and obese mice (n = 3); colors indicate cell cluster. Each symbol represents a single cell. e, Dot plot of conserved genes between humans (top) and mice (bottom) specifically expressed by each macrophage cluster. Color intensity indicates expression level, and dot size indicates gene expression frequency (percentage of cells expressing the gene). f, Proportion of human LM subsets among all living CD45+CD68+HLA-DR+ myeloid cells in perfused (n = 4) and non-perfused livers (n = 3) (LM4 perfused versus non-perfused, P < 0.0001). ns, not significant. g, Experimental outline: (1) resected livers were perfused to flush out the intrahepatic blood; (2) livers were then digested and cells from the intrahepatic blood and the digested liver tissues were compared using flow cytometry. h, Proportion of LM subsets among all living CD45+CD68+HLA-DR+ myeloid cells in intrahepatic blood and digested liver tissue from the same donors (n = 4) (LM2 blood versus liver, P = 0.0084; LM4 blood versus liver, P < 0.0001). i, Proportion of murine LM cells in livers from wildling (n = 5) and control (n = 5) mice (KCs control versus wildling, P < 0.0001; Caps macs control versus wildling, P = 0.0003). Caps macs, capsular macrophages. Data are presented as mean ± s.e.m. P values were calculated by two-tailed Mann–Whitney U-test (b) or two-way ANOVA with adjustment for multiple comparisons (f, h, i). **P < 0.01; ***P < 0.001; ****P < 0.0001. Illustrations in a and g were partly created using components adapted from Servier Medical Art, provided by Servier, licensed under a Creative Commons Attribution 3.0 unported license.

