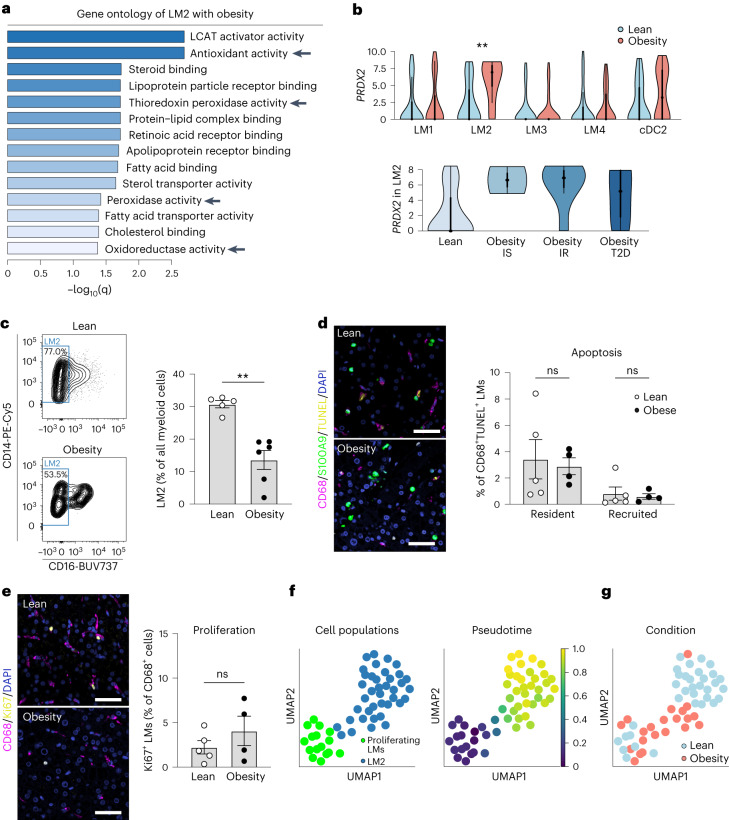
Fig. 4. A distinct population of LM cells expresses increased levels of antioxidative genes.
a, Gene ontology analysis of enriched molecular functions in LM2 with obesity compared with lean. LCAT, lecithin–cholesterol acyltransferase. b, Gene expression distribution (log2(RPKM)) of PRDX2 in lean and obese LM subpopulations (top) or in LM2 stratified by obesity states (bottom). Dot indicates the median expression, thick line indicates the interquartile range, and thin line displays 1.5× interquartile range (LM2 lean versus obesity, P = 0.0025). IS, insulin sensitivity; IR, insulin resistance. c, Representative analysis of proportion of human LM2 cells among all myeloid cells (live CD45+CD14+HLA-DR+ cells; left) and proportion of LM2 in lean individuals (n = 5) and individuals with obesity (n = 6; right) (lean versus obese, P = 0.0043). d, Representative immunofluorescence images of CD68 (purple), S100A9 (green) and TUNEL (yellow) in human livers from lean individuals (n = 5) and individuals with obesity (n = 4) (left), and quantification of apoptotic CD68+S100A9− resident and CD68+S100A9+ recruited LM cells (right). Scale bar, 50 µm. e, Representative immunofluorescence images of CD68 (purple) and Ki67 (yellow) in human livers from lean individuals (n = 5) and individuals with obesity (n = 4) (left), and quantification of proliferating CD68+ LM cells (right). Scale bar, 50 µm. f, UMAP visualization of proliferating macrophages and LM2 cells colored by cell cluster (left) and by differentiation of proliferating myeloid cells to the LM2 cluster from pseudotime analysis (right). g, UMAP visualization of proliferating macrophages and LM2 cells colored by condition. Data are presented as mean ± s.e.m. P values were calculated by one-way (b) or two-way (d) ANOVA with adjustment for multiple comparisons or by two-tailed Mann–Whitney U-test (c, e). **P < 0.01.

