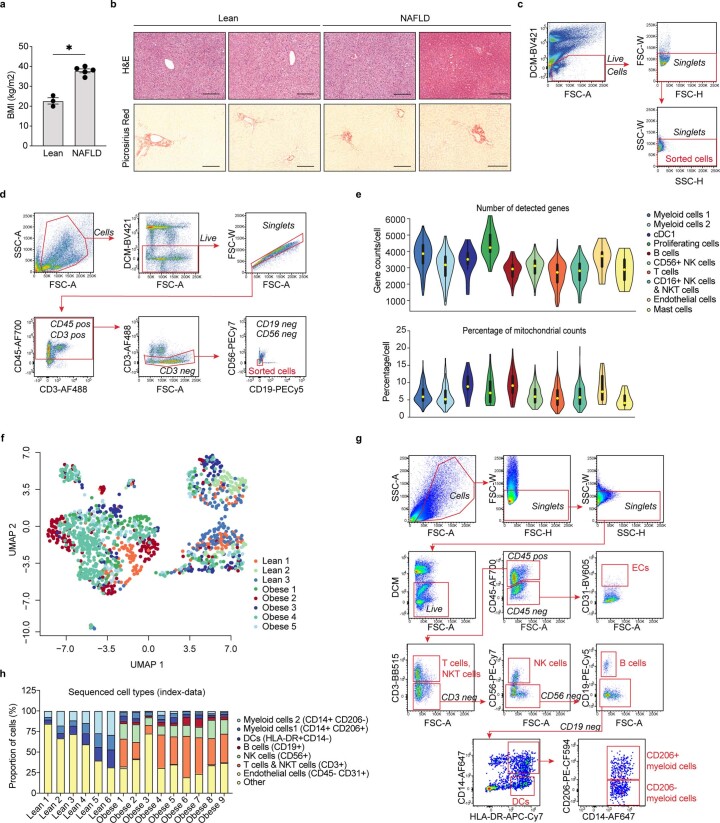
Extended Data Fig. 1. Characterisation of human liver non-parenchymal cells.
a, Average BMI of sequenced individuals (n=3 lean and n=5 with obesity; P=0.0357). b, Representative images of H&E and picrosirius red staining of livers from lean individuals and individuals with obesity and NAFLD. Scale bar, 200µm. Images are representative of 5 individuals per condition (cohort 1). c, Gating scheme for sorting of NPCs from patients with obesity. Sorted cells were gated as live, single cells. d, Gating scheme for sorting of myeloid cells from lean individuals. Sorted cells were gated as live, single cells, CD45+CD3-CD19-CD56- cells. e, Violin plots of the number of detected genes (top) and the percentage of mitochondrial genes (bottom) across non-parenchymal cells from lean (n=3) and NAFLD (n=5) livers. Yellow dot indicates the median, bold line indicates the interquartile range and thin line displays the 1.5x interquartile range. f, UMAP visualization of single NPCs coloured by individual donors. g, Gating scheme for flow cytometric analysis of all sequenced NPCs (from the FACS-index data) gated using fluorescence minus one (FMO) controls and h, proportion of cell types from all sequenced plates from livers of lean individuals (n=6 plates) compared to individuals with obesity (n=9 plates). Data are presented as mean ± s.e.m. P values were calculated two-tailed Mann-Whitney test. *p < 0.05, **p < 0.01, ***p < 0.001, and ****p < 0.0001. ns, not significant. BMI, body mass index; NAFLD, Non-alcoholic fatty liver disease; H&E, haematoxylin and eosin; DCM, dead cell marker.

