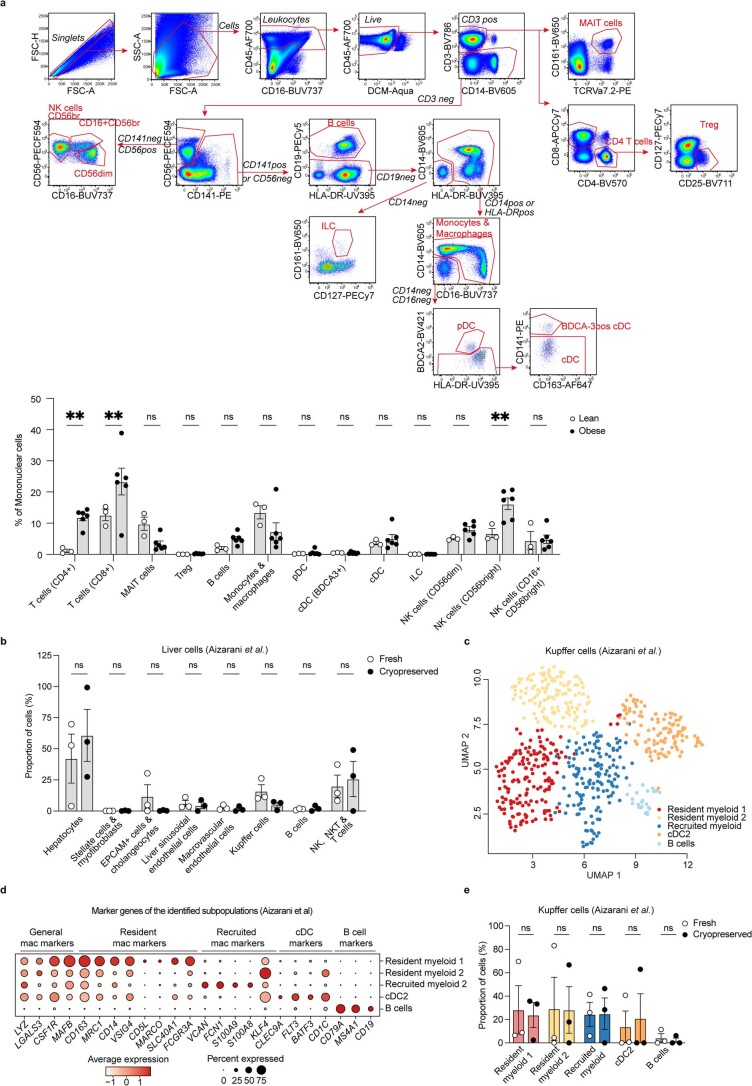
Extended Data Fig. 2. Characterisation of human liver non-parenchymal cells.
a, Top: Gating scheme for flow cytometric analysis of human NPCs from lean individuals and individuals with obesity. Black regular text indicates markers used for each gating, black italic text indicates the selected population and red text the final subset. Several clean up steps have been implemented that are not displayed here, such as clean-up of staining artefacts, removal of cells expressing CD14/CD19/CD4 for final NK cell population, and removal of TCRVa7.2/CD4 for final ILC population. Bottom: Proportion of immune cell subsets among all live CD45+ cells after flow cytometry analysis. Results are from lean perfused liver samples (n=3) and obese non-perfused liver samples (n=6) (CD4 T cells lean vs obese P=0.0010, CD8 T cells lean vs obese P=0.0012 and CD56bright NK cells lean vs obese P=0.0067). b, Proportion of sequenced human liver cells from fresh (n=3) and cryopreserved (n=3) samples by scRNA-seq from the previously published data set (GSE124395) by Aizarani et al. c, UMAP visualization of the Kupffer cell cluster annotated by Aizarani et al.; colours indicate subpopulations from reanalysis. Each symbol represents a single cell. d, Dot plot of marker genes for each subpopulation. Colour intensity indicates expression level and dot size indicates gene expression frequency (percentage of cells expressing the gene) by Aizarani et al. e, Proportion of fresh and cryopreserved cells for each subpopulation in the Kupffer cell cluster (n=3 liver samples per group) from Aizarani et al. Data are presented as mean ± s.e.m. P values were calculated by two-way ANOVA with adjustment for multiple comparisons. **p < 0.01. ILC, innate lymphoid cells; Treg, regulatory T cells; Classic. mono, classical monocyte; Interm. mono, intermediate monocyte; nonclassic. mono, nonclassical monocyte; conv. mDC, conventional mDC; CD56br, CD16-CD56bright NK cells; CD16+CD56br, CD16+CD56bright NK cells; CD56dim, CD56dim NK cells. Mac, macrophages.

