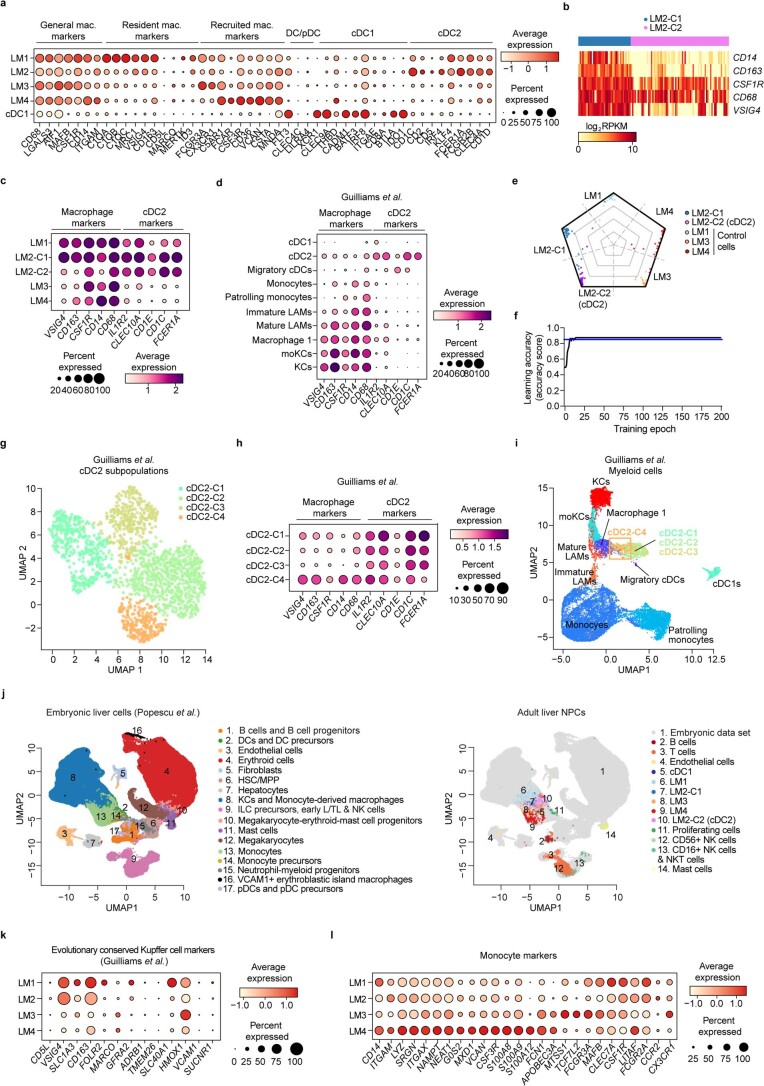
Extended Data Fig. 3. Characterisation and annotation of human liver myeloid cells.
a, Dot plot of gene expression (log2 RPKM) of macrophage and dendritic cell markers. Colour intensity indicates expression level and dot size indicates gene expression frequency (percentage of cells expressing the gene). b, Heatmap of gene expression (log2 RPKM) of macrophage markers in the LM2 and cDC2 subclusters. c, Dot plot of gene expression of macrophage and cDC2 marker in our human myeloid cell data and d, in a published data set (GSE192742) of human myeloid cells by Guilliams et al. e, Radar plot visualization of the assigned cell-type score by the neural network classifier for each individual cell in the LM2/cDC2 subclusters and control cells; colours indicate cell cluster. f, Accuracy of the neural-network classifier in learning 261 single cells of LM2, cDC2 and the control cell types (LM1, LM3 and LM4) visualized as a learning curve. g, Subcluster analysis of cDC2 cells from the published data set of human myeloid cells by Guilliams et al. and h, dot plot of macrophage and cDC2 markers for each subcluster. i, UMAP visualisation of the cDC2 subclusters from g in relation to other myeloid populations. Orange rectangle indicates position of cluster cDC2-4. j, Integration of the human NPC data with a published data set (E-MTAB-7407) of human embryonic liver cells by Popescu et al. k, Dot plot of gene expression of previously published evolutionary conserved marker genes of Kupffer cells in mice and humans by Guilliams et al. l, Dot plot of gene expression (log2 RPKM) of monocyte markers. Data are presented as mean ± s.e.m. P values were calculated by two-way ANOVA with adjustment for multiple comparisons. RPKM, Reads per kilobase of exon model per million mapped reads; pDC, plasmacytoid dendritic cells; cDC1, type 1 dendritic cells; cDC2, type 2 dendritic cells; KC, Kupffer cells; moKCs, monocyte-derived KCs; LAMs, lipid-associated macrophages; HSC/MPP, hematopoietic stem cells and multipotent progenitors; early L/TL, early lymphoid/T lymphocyte.

