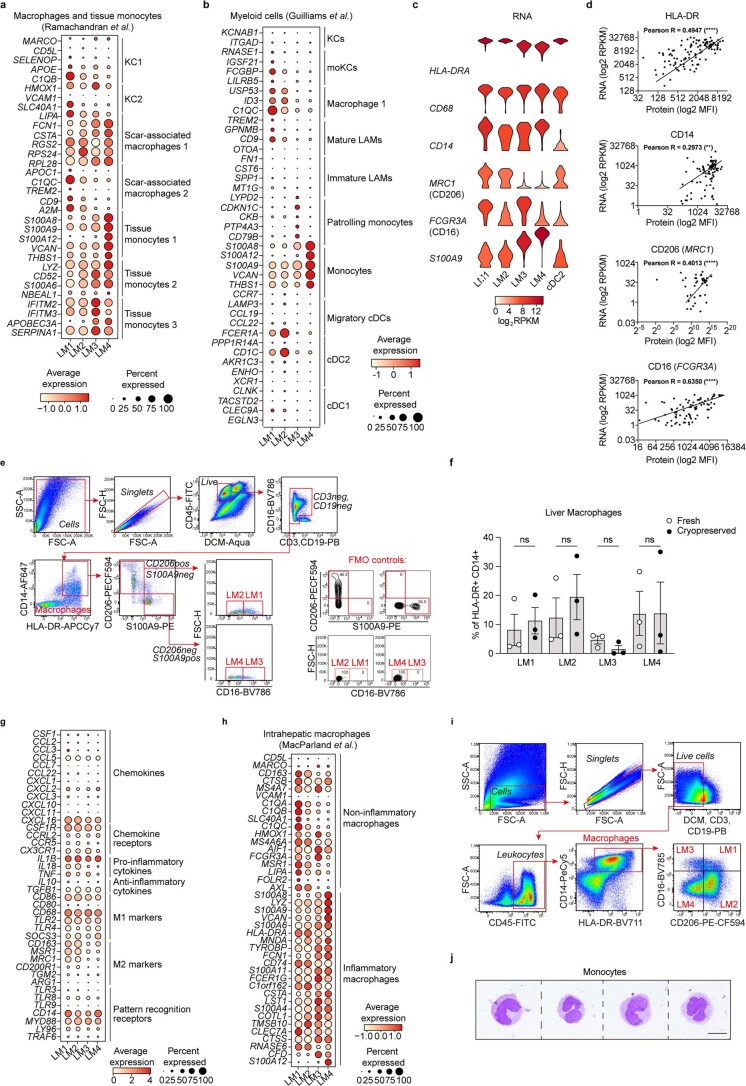
Extended Data Fig. 4. Characterisation and annotation of human liver myeloid cells.
a, Dot plot of gene expression (log2 RPKM) of previously published liver macrophage markers (top DEG for each cluster) by Ramachandran et al. Colour intensity indicates expression level and dot size indicates gene expression frequency (percentage of cells expressing the gene). b, Dot plot of previously published myeloid cell markers (top DEG for each cluster) by Guilliams et al. c, Violin plot of gene expression distribution (log2 RPKM; colours indicate mean expression) of signature markers used to define each LM cell population by flow cytometry analysis or sorting. Myeloid cells were defined as HLA-DR+CD68+ and LM1 was defined as CD14+CD206+CD16+S100A9low, LM2 was defined as CD14+CD206+CD16-S100A9low, LM3 was defined as CD14+CD206-CD16+S100A9high, LM4 was defined as CD14+CD206-CD16-S100A9high and cDC2 was defined as CD14-CD206+CD16-S100A9low. d, Correlation between RNA (log2 RPKM) and protein expression (log2 MFI; from indexed data) of selected signature markers on single LMs (HLA-DR P<0.0001, CD4 P=0.0011, CD206 P<0.0001, CD16 P<0.0001). Data are from 5 individuals with obesity. e, Gating scheme for flow cytometry analysis of human NPCs (representative gating plots are from a lean individual) gated using FMO controls and f, proportion of human LM subset in lean individuals and individuals with obesity before (fresh, n=3) and after cryopreservation (n=3). g, Dot plot of gene expression (log2 RPKM) of chemokines, chemokine-receptors, cytokines, M1 and M2 markers, and pattern recognition receptors in LM subsets. h, Dot plot of gene expression (log2 RPKM) of previously published liver macrophage marker genes by MacParland et al. i, Gating scheme for sorting of each individual LM subset (LM1-LM4) from human NPCs by FACS, gated using FMO controls. Representative gating plots are from a lean individual. j, Representative images of cytospins stained with Wright-Giemsa of isolated monocytes from peripheral blood mononuclear cells from one individual. Scale bar, 10µm. Data are presented as mean ± s.e.m. P values were calculated by two-way ANOVA with adjustment for multiple comparisons (f) or by two-tailed Pearson correlation (confidence interval: 95%). *p < 0.05. RPKM, Reads per kilobase of exon model per million mapped reads; MFI; mean fluorescence intensity; ns, not significant; KC, Kupffer cells; moKCs, monocyte-derived KCs; LAMs, lipid-associated macrophages.

