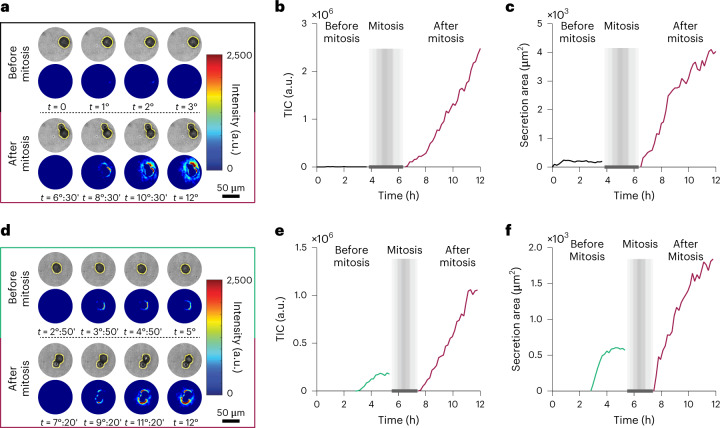
Fig. 4. Spatiotemporal monitoring of IgG secretion in mother and daughter cells.
a, 4D spatiotemporal secretion map for a hybridoma cell before and after division along with the corresponding optical images at selected time points that indicate secretion only for the daughter cells. The yellow lines around the cells define the boundary of the cells extracted by machine-learning algorithms. b, TIC curves that show type I cell behaviour for the daughter cells. c, Secretion area curves for the cells after mitosis. d, 4D spatiotemporal secretion map for a hybridoma cell before and after division with obvious secretion in both phases. e, TIC curves illustrating type II behaviour for the mother cell and type I behaviour for the daughter cells. f, Secretion area curves before and after mitosis. The grey boxes represent the time of mitosis and temporary changes in intensity due to cell movements before the cells settled down in their new positions.

